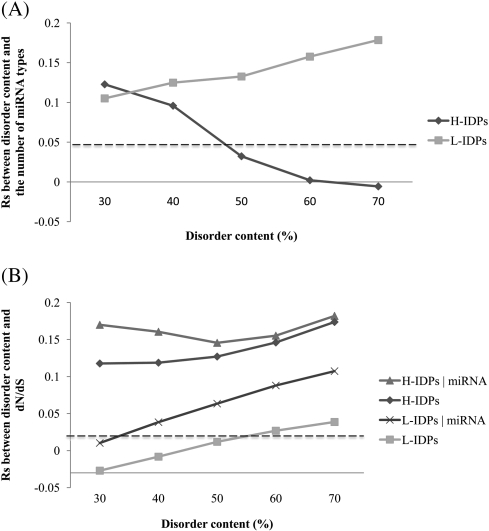
FIG. 2.
Spearman's rank correlations (Rs) between disorder content and the number of miRNA types and between disorder content and evolutionary rate (dN/dS). Proteins are divided into “H-IDPs” and “L-IDPs” groups according to whether the disorder content is higher or lower than the given threshold (the x axis). For example, proteins in the “H-IDPs” group and the “L-IDPs” group with the threshold of 50% are the groups with a disorder content higher and lower than 50%, respectively. Each point stands for the Rs value of the corresponding group. Five disorder thresholds are examined here to see how the correlations change under different thresholds. In (B), “H-IDPs|miRNA” and “L-IDPs|miRNA” represent the partial correlations (controlled for the number of miRNA types that regulate the gene) for the H-IDPs and L-IDPs groups, respectively. In both (A) and (B), points above the dotted line represent correlations significantly greater than zero by Spearman's rank test (P < 0.05).

