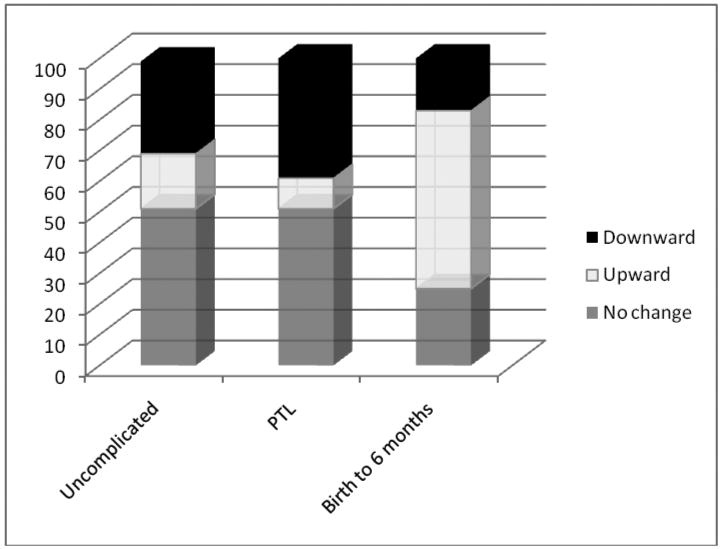
FIGURE 2. Fetal and infant growth trajectory patterns compared.

Proportions of individual growth trajectories characterized by upward centile-crossing, downward centile-crossing and no significant change in standard scores across the third trimester (defined as >0.67,<-0.67, >-0.67 and <0.67 standard scores, respectively, or the distance between major growth percentiles) among the present fetal study sample of term births from pregnancies with uncomplicated term labor and those complicated by preterm labor (PTL) compared to proportions of individual growth trajectories among a sample of infants assessed during their first six postnatal months from Mei et al., (2004), data from the California Health and Development Study (Van den Berg et al., 1988). The definitions for growth trajectories among the infant sample were based on infants crossing one or more major growth percentile on the United States CDC growth charts (Kuczmarski et al. 2000).
