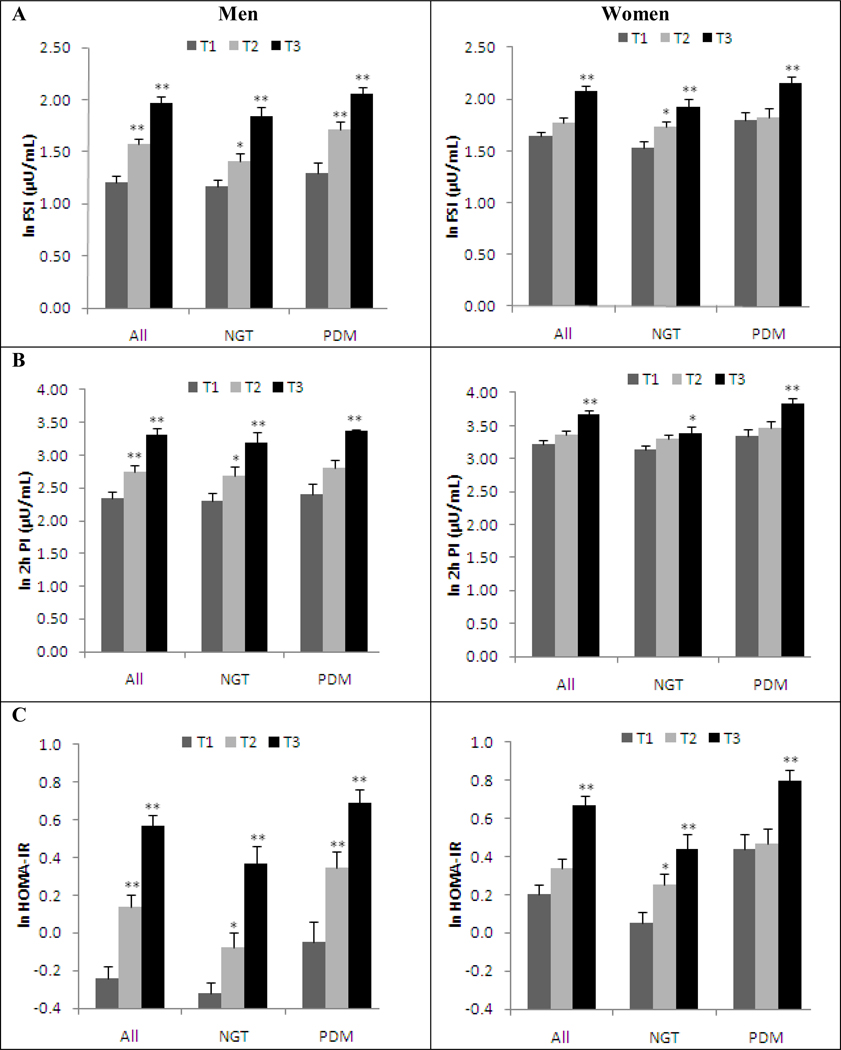
Figure 1.
The distribution of insulin resistance measurs classified by leptin tertiles, grouped for all subjects (all); subjects with normal fasting glucose (NGT); subjects with prediabetes (PDM).
A: log transformed mean fasting serum insulin levels for each tertile of plasma leptin concentrations, *p<0.05 compared with 1st leptin tertile; **p<0.01 compared with 1st leptin tertile. FSI, fasting serum insulin
B: log transformed mean 2h post-load insulin levels for each tertile of plasma leptin concentrations; *p<0.05 compared with 1st leptin tertile; **p<0.01 compared with 1st leptin tertile. 2h PI, oral glucose tolerant 2h postload insulin
C: log transformed mean HOMA-IR levels for each tertile of plasma leptin concentrations, *p<0.05 compared with 1st leptin tertile; **p<0.01 compared with 1st leptin tertile. HOMA-IR, homeostasis modeling accessible of insulin resistance.

