
Figure 11.
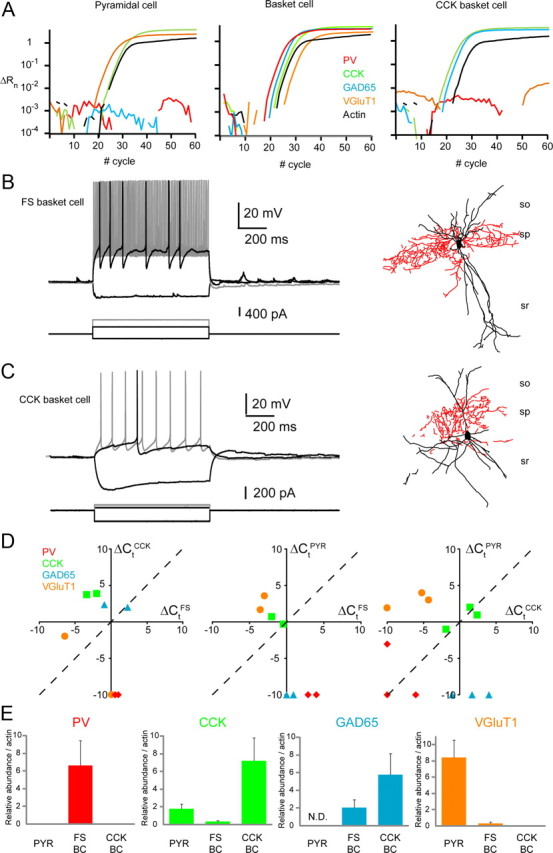
Quantitative scPCR comparisons between PV+ fast-spiking basket cells and CCK+ SCA/non-fast-spiking basket cells. A, Amplification plots for PV (red), CCK (green), GAD65 (blue), VGluT1 (yellow), and actin (black) for harvests from a representative pyramidal cell (left), fast-spiking basket cell (middle), and non-fast-spiking basket cell (right). Relative fluorescence intensities (ΔRn) were plotted against PCR cycle numbers on a logarithmic scale. B, C, Electrophysiological (left) and morphological (right) profiles of the fast-spiking (B) and non-fast-spiking (C) basket cells that were recorded for the quantitative scPCR analysis in A. D, Pairwise comparisons of the relative abundance of PV, CCK, GAD65, and VGluT1 in individual pyramidal (PYR), fast-spiking basket (FS), and non-fast-spiking basket/SCA (CCK) neurons (n = 5, 4, and 5, respectively). Cells were tested in pairs and plotted versus each other on the same graph. Data were normalized to actin mRNA levels by plotting ΔCt(probed transcript) = Ct(actin) − Ct(probed transcript). Each point represents the ΔCt for the indicated transcript of a cell pair processed in parallel. The dashed line represents same ΔCt value for the two cell types tested such that data points above the dashed line indicate higher abundance in the cell whose ΔCt is plotted on the y-axis, while points below the line indicate higher expression within the cell whose ΔCt is plotted along the x-axis. At left, two CCK cells (y-axis) are plotted against two FS cells (x-axis); the middle panel shows the data for two PYR (y-axis) FS (x-axis) pairs processed in parallel; the right panel illustrates findings for three PYR (y-axis)/CCK (x-axis) cell pairs. When the transcript was not detected, ΔCt value was set arbitrarily at −10. E, Histograms of mean target mRNA abundance relative to actin mRNA calculated from the ΔCt values plotted in D (see Materials and Methods) for PYR (n = 5), FS-BC (n = 4), and CCK-BC (n = 5) harvests. Error bars indicate SEM.