
Figure 4.
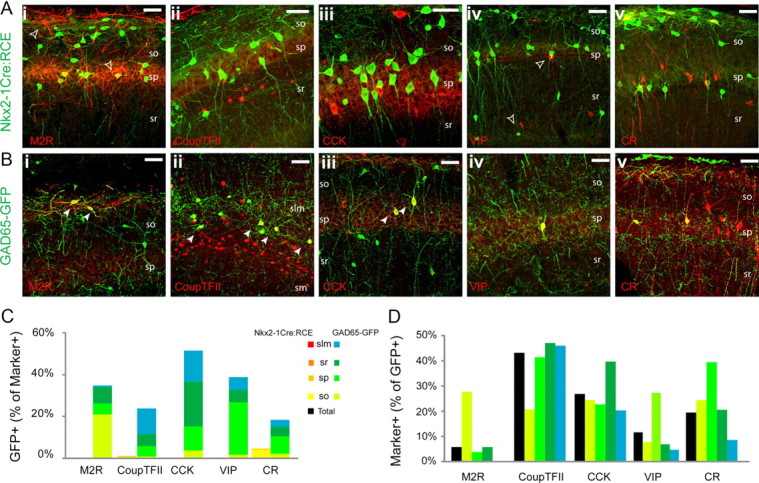
Immunohistochemical markers primarily associated with CGE-derived interneurons. A, B, Representative images illustrating the coexpression of GFP with M2R (i), CoupTFII (ii), CCK (iii), VIP (iv), and CR (v) in the Nkx2-1Cre:RCE (A) and GAD65-GFP (B) lines. The filled arrowheads indicate interneurons coexpressing GFP and the indicated marker. The open arrowheads indicate cells expressing the indicated marker but not GFP. C, Histogram showing the contribution of GFP+ cells from Nkx2-1Cre:RCE (warm colors) and GAD65-GFP (cool colors) lines to the populations of M2R-, CR-, CCK-, VIP-, and CoupTFII-immunolabeled interneurons in CA1 (n = 76, 151, 242, 144, and 216, respectively, in the Nkx2-1Cre:RCE; n = 133, 854, 281, 163, and 1376, respectively, in the GAD65-GFP). D, Number of cells coexpressing GFP with M2R, CR, CCK, VIP, and CoupTFII in the GAD65-GFP line presented as a percentage of the total number of GFP+ cells [n = 867, 798, 545, 556, 767, respectively, in the GAD65-GFP; note that group data concerning GFP+/VIP+ cells in GAD65-GFP mice includes counts previously reported as supplemental data in Cea-del Rio et al. (2010)]. Scale bar: 25 μm.