
Figure 5.
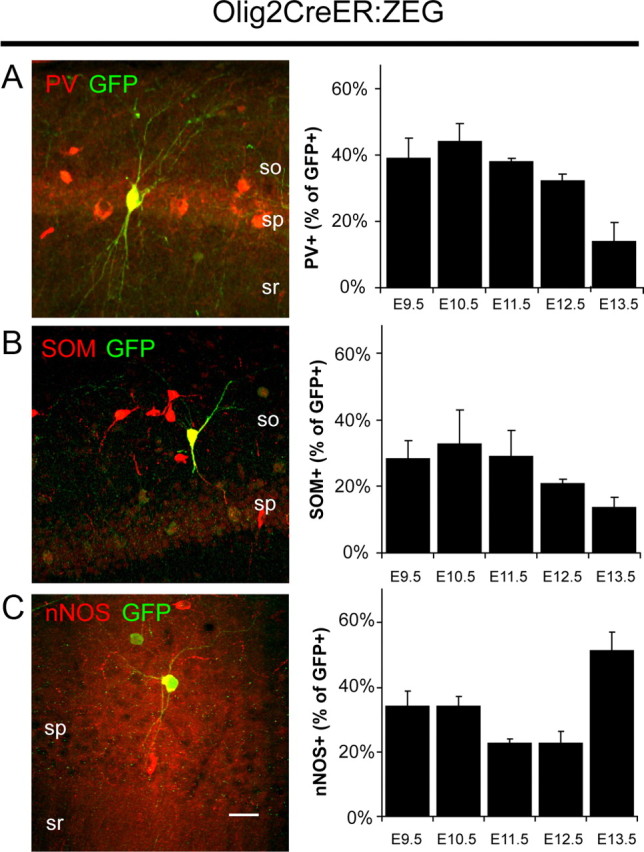
Inducible genetic fate mapping of MGE-derived interneurons. A–C, Left, Representative examples of PV (A), SOM (B), and nNOS (C) expression in fate-mapped interneurons in the mature hippocampus of Olig2CreER:ZEG mice treated with tamoxifen at E9.5 (for PV and SOM) or E10.5 (for nNOS). Scale bar: 25 μm. Right, Contribution of PV+ (A), SOM+ (B), and nNOS+ (C) interneurons to the cohort arising from MGE between E9.5 and E13.5 [for PV, n = 179, 141, 121, 177, and 50, respectively; for SOM, n = 89, 104, 73, 97, and 37; for nNOS, n = 79, 79, 124, 79, and 39; group data for GFP+/nNOS+ cells were previously reported by Tricoire et al. (2010)]. Error bars indicate SEM.