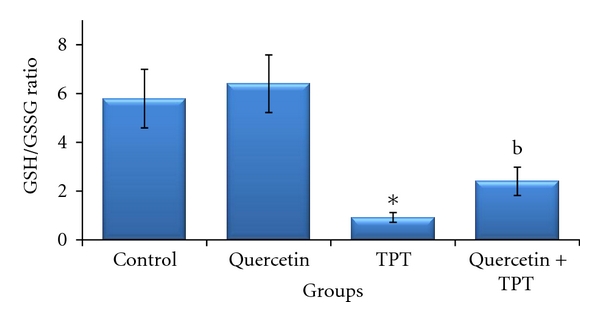
Figure 4.

Effects of quercetin (100 mg/kg) and/or topotecan (TPT; 1 mg/kg) on mouse bone marrow reduced and oxidized glutathione (GSH/GSSG) ratio (mean ± SD). *P < 0.05 versus control (Kruskal-Wallis test followed by Dunn's multiple comparisons test), b P < 0.01 versus TPT alone (Mann-Whitney U test).
