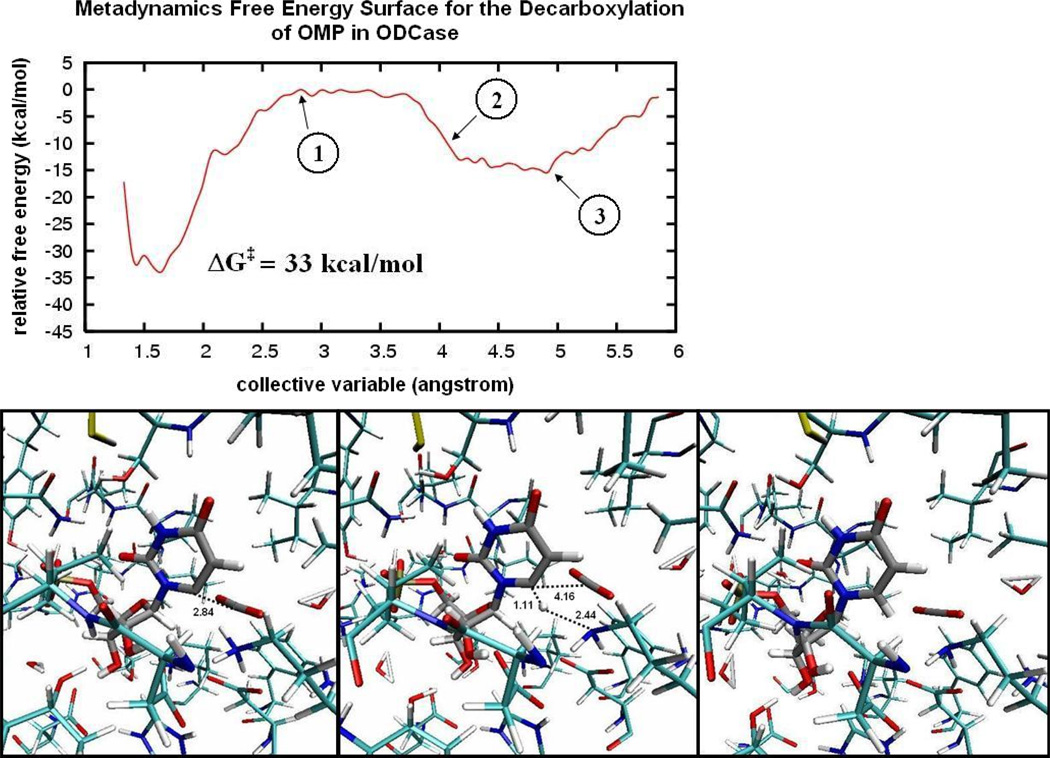
Figure 7.
Metadynamics simulation of the direct decarboxylation of OMP in ODCase for the large QM subsystem. (Top) The free energy profile as a function of the CV. The first point marked on the curve, 1, is the transition structure for decarboxylation. Energies are shown relative to this point. (bottom, left). The next point on the graph, 2, is after decarboxylation has occurred and a proton is being transferred from an active site lysine to OMP (bottom, middle).The final highlighted point on the graph, 3, is the stable product (bottom, right). The error associated with the metadynamics was found to be 1.1 kcal/mol for this simulation.

