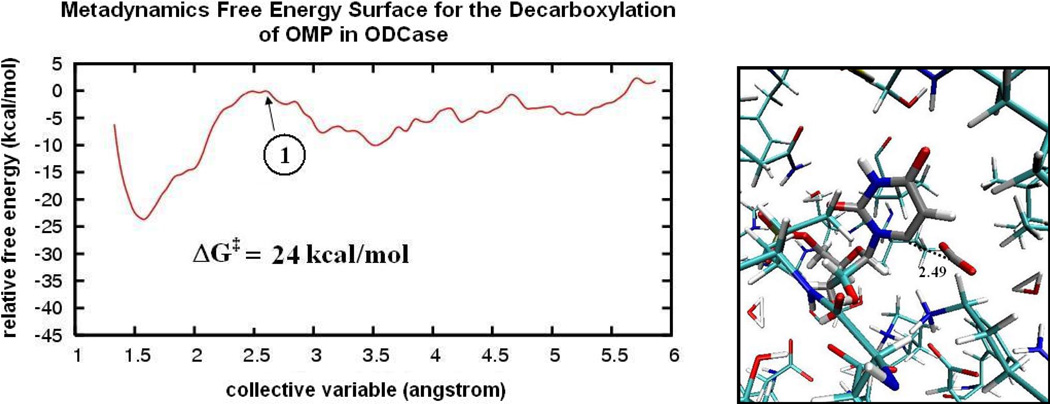
Figure 8.
Metadynamics simulation of the direct decarboxylation of OMP in ODCase for the Carloni QM subsystem case. (Left) The free energy profile as a function of the CV. The first point marked on the curve, 1, is the transition state for decarboxylation. Energies are shown relative to this point. (Right) A snapshot of the point on the graph, 1, is near the transition state (in the simulation) for decarboxylation.

