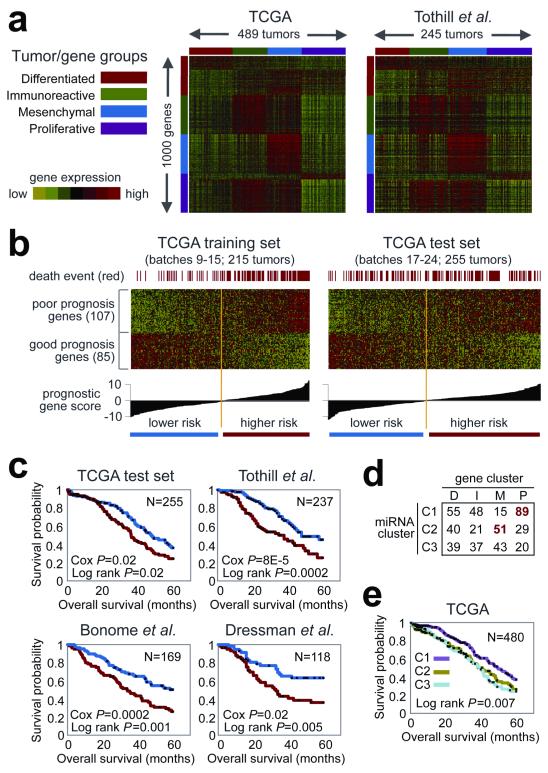
Figure 2. Gene and miRNA expression patterns of molecular subtype and outcome prediction in HGS-OvCa.
(a) Tumors from TCGA and Tothill et al. separated into four clusters, based on gene expression. (b) Using a training dataset, a prognostic gene signature was defined and applied to a test dataset. (c) Kaplan-Meier analysis of four independent expression profile datasets, comparing survival for predicted higher risk versus lower risk patients. Univariate Cox p-value for risk index included. (d) Tumors separated into three clusters, based on miRNA expression, overlapping with gene-based clusters as indicated. (e) Differences in patient survival among the three miRNA-based clusters.

