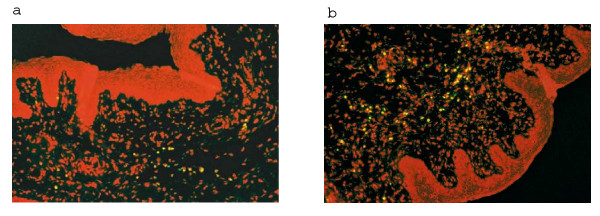
Figure 4.
The Fluorescence micrograph depicting lack of TUNEL staining of control and CAD treated vaginal tissues. (a) Control tissue treated with K-Y jelly alone (b) tissues treated with 82 mg/ml CAD. Red fluorescence represents nuclei stained with propidium iodide. Green or yellow represents apoptotic nuclei containing fragmented DNA. Original magnification × 200.

