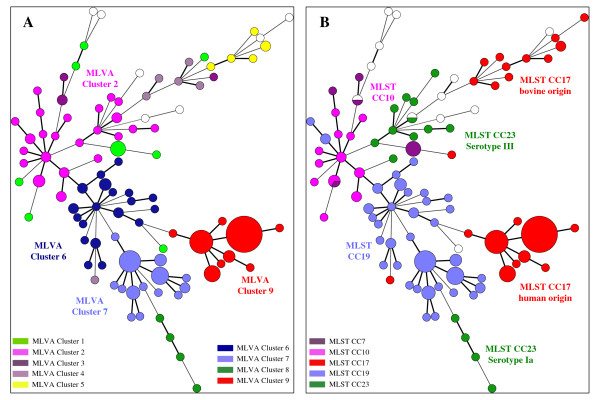
Figure 4.
Minimum spanning tree (MST) representation of the MLVA clustering. The colors used in figure 4A are based on MLVA clusters. The colors used in figure 4B are based on MLST clonal complexes. White circles correspond to genotypes not clustered by MLVA or MLST. The MLVA data for 189 strains, including 3 reference strains, were analyzed in BioNumerics. Each circle represents an MLVA genotype and its size is proportional to the number of strains. A logarithmic scale was used when drawing branches. The thicker branches link the MLVA genotypes differing by only one allele, the thinner branches link MLVA genotypes differing by more than one allele.

