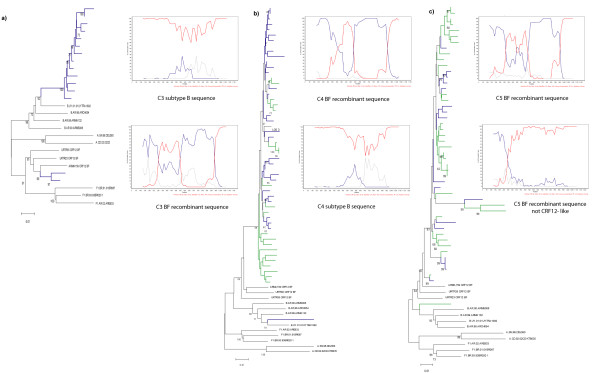
Figure 2.
NJ phylogenetic tree and bootscanning analysis of HIV-1 pol region from the sequences of HIV-1 positive individuals with evidence of dual infection. The trees were constructed with the NJ method and Kimura two-parameter model (ts/tv = 2/1) and they were performed with the complete fragment analyzed. Bootstrap values (1000 resamples) higher than 60 and scale are shown. Bootscanning analysis was performed comparing the sample with the reference sequences: HXB2; WR27, MN and RL42 (subtype B: red line); BR020, VI850, FIN9363 (subtype F: blue line), and U455, SE7253, 92UG037 (subtype A: grey line). A 200 nt window advanced in 20 nt increments was used by the NJ method and Kimura two-parameter model (ts/tv = 2/1). a) Case 3; b) Case 4; c) Case 5. Sequences from sample 1 are indicated with blue lines while the sequences from sample 2 are in green.

