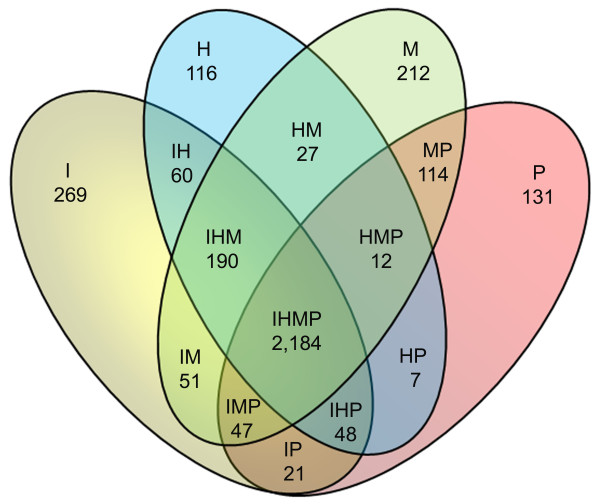
Figure 5.
Genome content comparison. Venn diagram of genome content unique to and shared between B. intermedia (I), B. hyodysenteriae (H), B. murdochii (M) and B. pilosicoli (P) based on a BLASTP comparison analysis with an e-value cutoff set to 1e-9. 15 classes can be recognized (IHMP, IHM, IHP, IMP, HMP, IH, IM, IP, HM, HP, MP, I, H, M and P).

