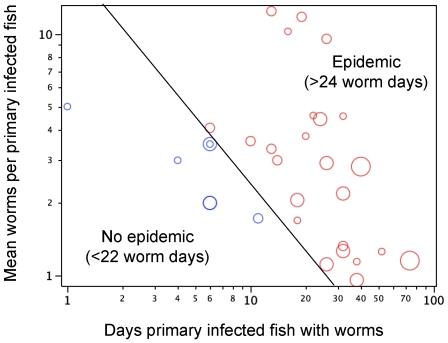
Figure 2. Characteristics of 24 tanks with an epidemic (transmission occurred) and seven tanks without an epidemic (no transmission occurred).
Worm intensity (mean number of worms on a primary infected fish for the duration of infection) vs. the duration of infection (final day of infection minus initial day of infection). Circle size indicates the density of the treatment. The line (drawn to help visualization) divides tanks where one or more exposed fish became infected (transmission) from tanks where exposed fish remained uninfected (no epidemic).

