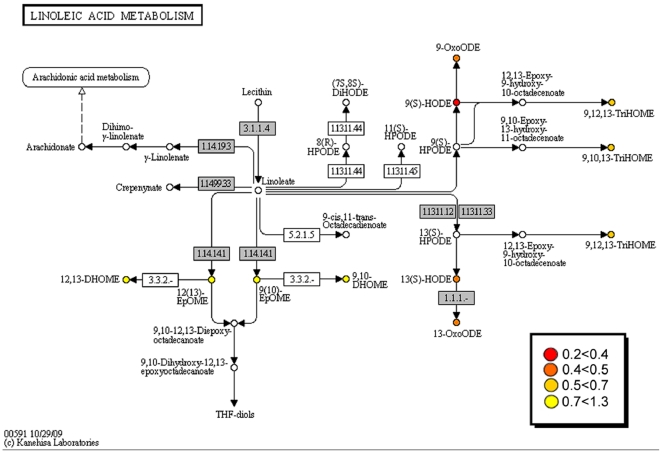
Figure 2. Alterations in oxylipin responses to subway air exposure mapped to the KEGG Linoleic Acid pathway (hsa00591).
Differences between groups are shown as ratios (asthmatics/healthy individuals) between self-normalized oxylipin levels (Subway/Control, S/C; Table 3). Similar enzymatic conversions can occur via the α-linolenic acid pathway, but are not shown here (see KEGG pathway hsa00592). Data are color-coded as described in the figure to display the ratio and were mapped to KEGG using the KegArray software as previously described [58].

