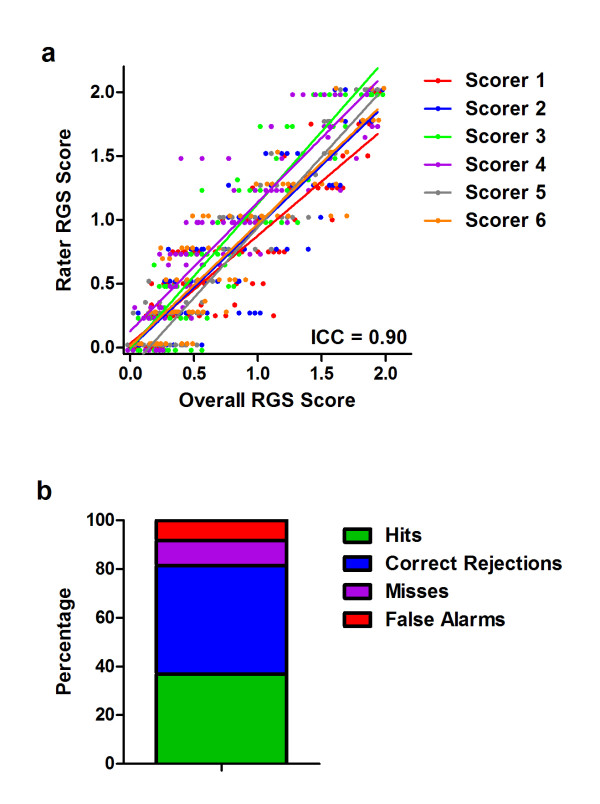
Figure 3.
Interrater reliability (a) and accuracy (b) of the RGS in the quantification of pain. In both cases 100 photographs were scored, half pain (CFA) and half no pain (baseline). Scorer 1 developed the RGS, and trained the others; the signal detection data represent the average of all six scorers. Hits: pain photograph scored as pain; Correct Rejections: no pain photograph scored as no pain; Misses: pain photograph scored as no pain; False Alarms: no pain photograph scored as pain. ICC: intraclass correlation coefficient (see text).

