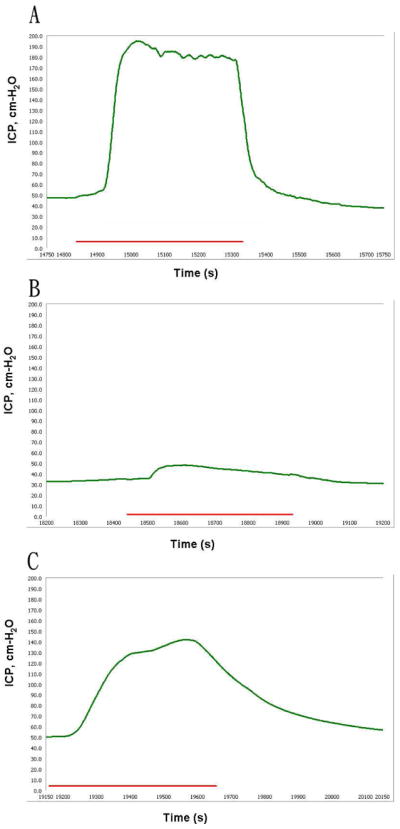
Figure 1.

Measurement of erectile function.
Representative graphs are presented for rats fed a normal diet and received phosphate buffered saline (A), rats fed a high-fat diet and received PBS (B), and rats fed a high-fat diet and received ADSC (C). The green curve and red bar represent the intracavernous pressure (ICP) values in response to nerve stimulation and the duration of cavernous nerve stimulation (50 seconds), respectively.
