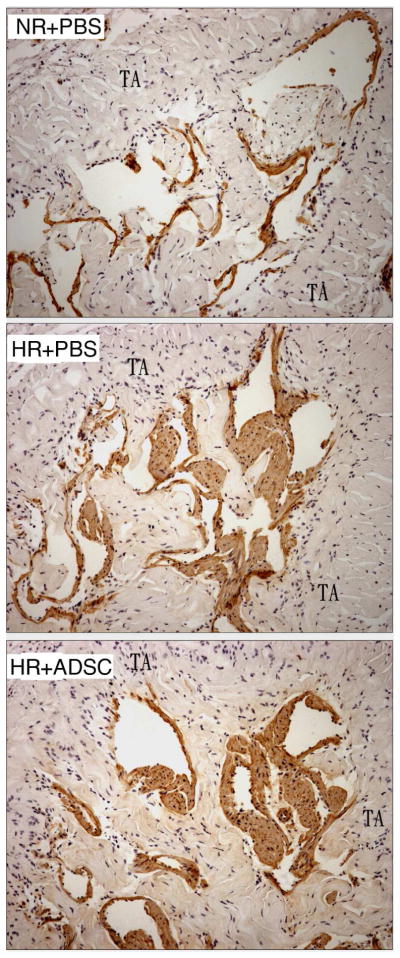
Figure 6.
Analysis of smooth muscle content in the corpus cavernosum by alpha-smooth muscle actin staining. Representative graphs are presented for rats fed a normal diet and received PBS (NR+PBS), rats fed a high-fat diet and received PBS (HR+PBS), and rats fed high-fat diet and received ADSC (HR+ADSC). Smooth muscle is stained brown. The smooth muscle content was higher in HR than in NR. Magnification is X 100. TA = tunica albuginea.

