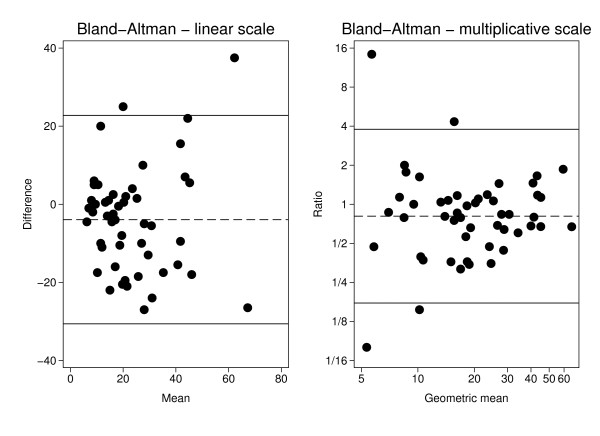
Figure 3.
Bland-Altman plots for Ki67-positive cells in surgical samples and core biopsies. (3a) The difference in percentage of Ki67-positive cells between surgical sample and core biopsy versus the corresponding mean for each of the 50 pairs. Two hundred cells were counted. The dashed line represents the average difference 3.9% and the solid lines a 95% reference interval around this estimate. (3b) The ratio of the percentage of Ki67-positive cells in the surgical sample to the corresponding percentage in the core biopsy versus the geometrical mean for each of the 50 pairs. Two hundred cells were counted. The dashed line at 0.81 represents the geometric mean of the ratios (19% lower Ki67 fraction the surgical sample) and the solid lines a 95% reference interval around this estimate.

