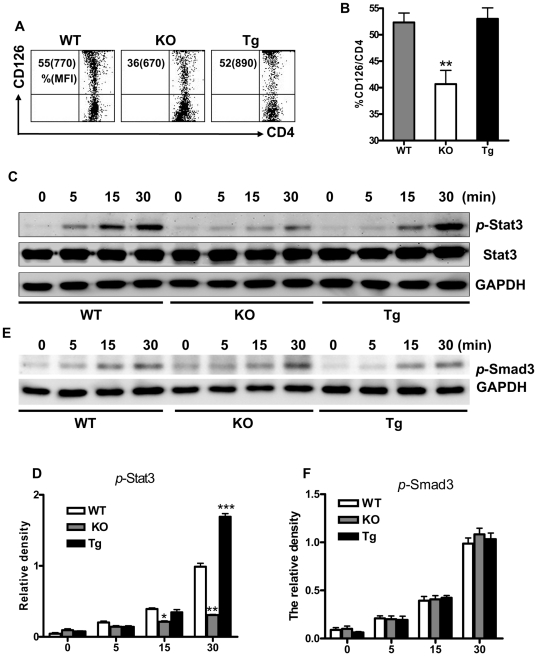
Figure 4. Differential CD126 expression and IL-6-triggered signaling in CD4+ cells from B6 WT, B6.Baff−/−, and B6.BTg mice.
Panel A: LN cells were double-stained for CD4 and CD126 from the indicated mice. The dot plots reflect representative mice, with the values outside the parentheses indicating the percentages of CD126+ cells within the CD4+ population and the values inside the parentheses indicating the mean fluorescence intensity of the CD126+ cell population. Panel B: Results (mean ± SEM) are presented for the 3 mice in each cohort. Panels C–D: Naive CD4+ cells from the indicated mice were stimulated with IL-6 (10 ng/ml) + TGF-β (2 ng/ml) for the indicated periods of time (minutes) and were subjected to Western blot analysis for total Stat3, phosphorylated Stat3 (p-Stat3), and GADPH (panels C–D) and phosphorylated Smad3 (p-Smad3) and GADPH (panels E–F). The levels of p-Stat3 and p-Smad3 were normalized to GAPDH, with the ratios of p-Stat3 or p-Smad3 to GADPH at 30 minutes being arbitrarily assigned a value of 1. The results shown in panels C and E are representative of the 7 independent experiments, and the results shown in panels D and F are the mean ± SEM of these 7 experiments. *, p≤0.05; **, p≤0.01; ***, p≤0.001 in comparison to WT values.

