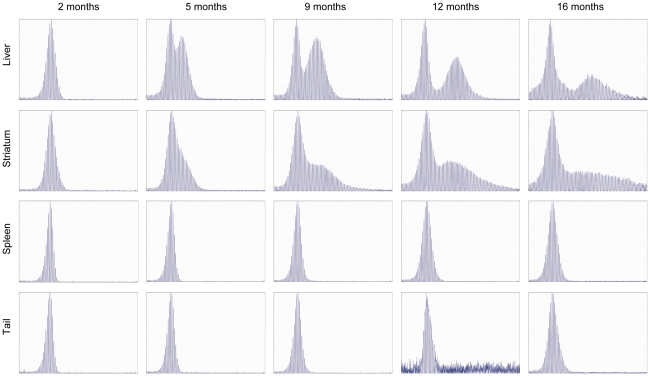
Figure 1. GeneMapper analysis of HdhQ111 CAG repeats shows pronounced age-dependent repeat instabilities in striatum and liver.
Genomic DNA from liver, striatum, spleen and tail of HdhQ111/+ mice (CD1 background) was used for PCR amplification of the HTT CAG repeat followed by GeneMapper analysis. Five time points were used: 2 months (5 mice); 5 months (5 mice); 9 months (5 mice); 12 months (3 mice); 16 months (5 mice). Representative GeneMapper traces are shown.

