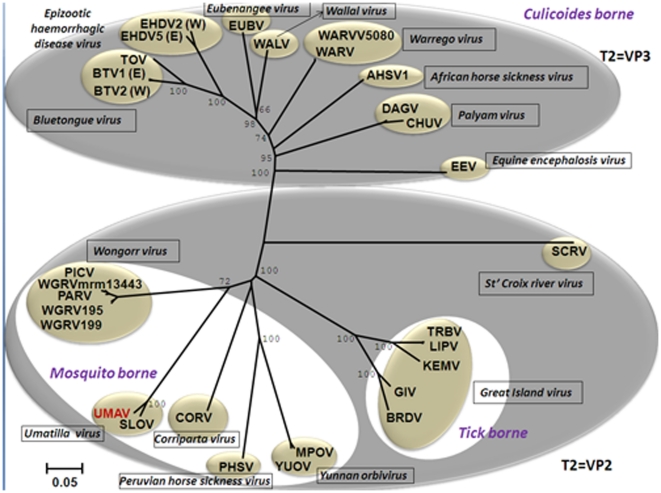
Figure 3. Neighbour-joining tree comparing orbivirus T2 protein sequences.
The tree was constructed using distance matrices, generated using the p-distance determination algorithm in MEGA 4.1 (1000 bootstrap replicates) [48]. Since many of the available sequences are incomplete, the analysis is based on partial sequences (aa 393 to 548, numbered with reference to the aa sequence of BTV VP3(T2). The numbers at nodes indicate bootstrap confidence values after 1000 replications. The trees shown in Figures 4 and 5 were drawn using same parameters. The UMAV isolate characterised in this study is shown in red font. Full names of virus isolates and accession numbers of T2 protein sequences used for comparative analysis are listed in (Table S1). ‘(E)’ and ‘(W)’ - indicate eastern and western strains, respectively.

