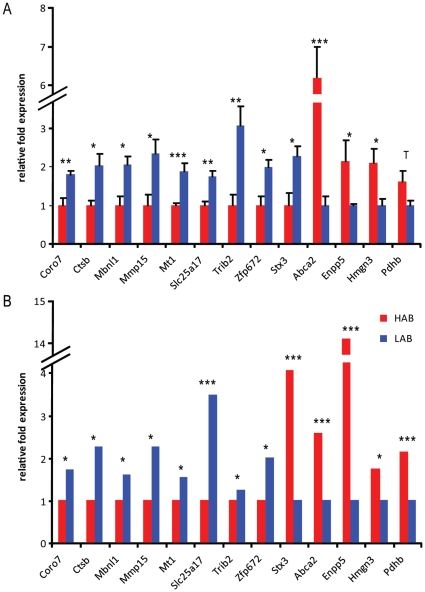
Figure 1. Gene expression profiles of HAB vs. LAB mice in multiple brain regions.
(A) gene expression confirmed by quantitative PCR and (B) as detected by microarray-based gene expression analysis. N = 6–10 per group. Data are presented as means and for (A) +SEM; T p<0.1, * p<0.05, ** p<0.01, *** p<0.001.

