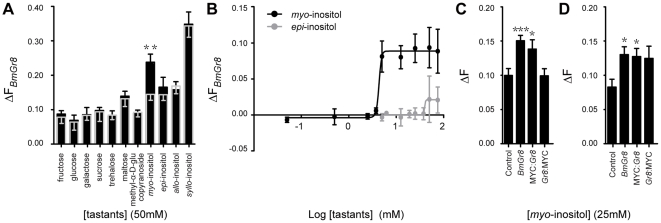
Figure 2. In vitro responsiveness of BmGr8 to sugars and other tastants.
Sf9 cells were transfected with BmGr8 in the PIB/V5-His vector. Cells were loaded with Fluo4 and the change in fluorescence (ΔF) was measured in response to tastants. ΔF was calculated as the ratio of change in fluorescence upon the addition of ligand relative to change in fluorescence following the addition of ionomycin. (A) Responses of BmGr8 to eleven tastants at 50 mM. The mean responses of cells transfected with empty expression vector are indicated by the grey bar and grey error bars, mean responses of Gr8 transfected cells are indicated by the black bars and black error bars. (B) Log concentration-response curves for BmGr8 responses to myo-inositol and epi-inositol. The average responses of cells transfected with empty expression vector have been subtracted. (C) Function of MYC-epitope tagged receptor responses to 50 mM myo-inositol. Control = empty vector, Gr8 = BmGr8 transfected, MYC:Gr8 = transfected with BmGr8 N-terminally fused to two MYC-epitope copies, Gr8:MYC = transfected with BmGr8 C-terminally fused to two MYC-epitope copies. (D) MYC-epitope tagging as for (C). Calcium imaging assay saline contains 170 mM D-glucose. See Table 2 for analysis of the statistical significance by two tailed Student's t test. Error bars in (A), (C) and (D) indicate the calculated error of the difference between means = SE ( ), (B) indicate the standard error of the mean. *** p≤ 0.001, **p<0.01, *p<0.05.

