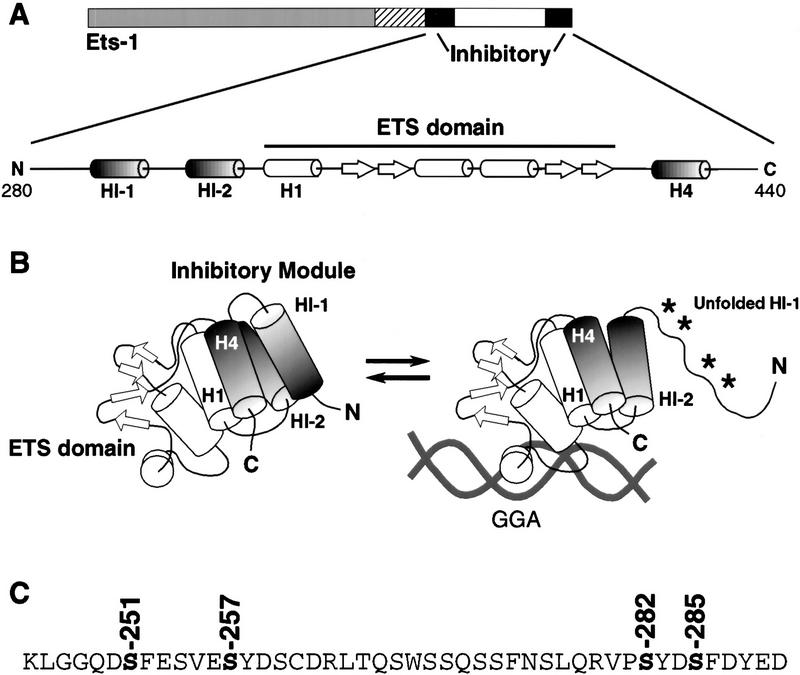
Figure 1.
Model of Ets-1 autoinhibition. (A) Schematic of Ets-1 showing DNA-binding domain (ETS domain, white), regions required for autoinhibition (inhibitory, black) and calcium-dependent phosphorylation (hatched). Expanded: secondary structural elements of the inhibitory module and ETS domain. α-Helices are indicated by barrels; β strands by arrows. (B) Structural model. α-Helices H1, HI-1, HI-2, and H4 form the inhibitory module. DNA binding is coupled to a conformational change that includes loss of structure in helix HI-1 and exposure of proteolytic cleavage sites (asterisks, Petersen et al. 1995; Jonsen et al. 1996). (C) Amino acid sequence spanning sites of calcium-dependent phosphorylation (hatched in A). In vivo calcium-dependent phosphorylation sites are indicated (Rabault and Ghysdael 1994).

