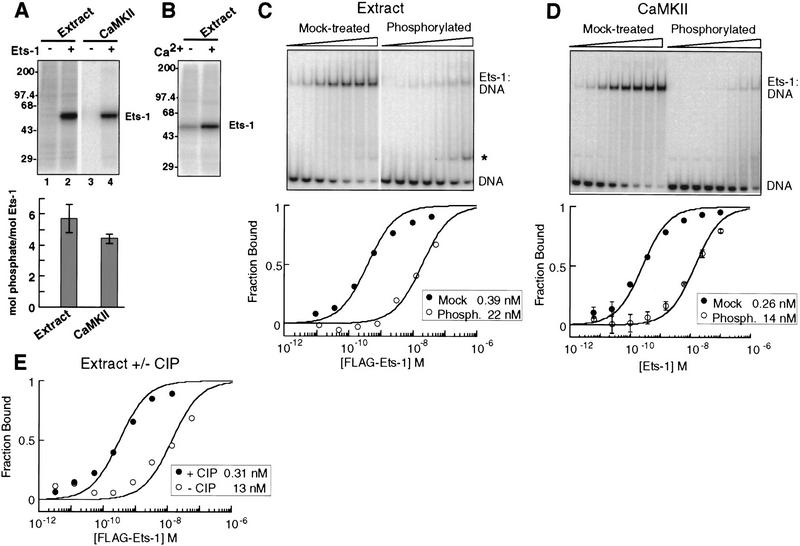
Figure 2.
Calcium-dependent phosphorylation and inhibition of Ets-1 DNA binding. (A) Phosphorylation of Ets-1 by nuclear extract and CaMKII. (Top) PhosphorImage of radiolabeled kinase reaction products separated by SDS-PAGE. (Bottom) Apparent phosphorylation stoichiometry of Ets-1 treated as in lanes 2 and 4 of top panel. Mean (±s.d.) of three experiments. (B) Calcium dependence of Ets-1 phosphorylation by nuclear extract. Ets-1 was treated with nuclear extract and [γ-32P]ATP, with or without calcium and analyzed as in A. (C) Nuclear extract treatment inhibits Ets-1 DNA binding 50-fold. Flag–Ets-1 was incubated with nuclear extract without (mock-treated) or with (phosphorylated) ATP and repurified on α-Flag agarose. (Top) Repurified protein was tested for DNA binding by EMSA. A degradation product with DNA-binding activity is indicated (*). (Bottom) Binding curves were generated by measuring the free DNA signal. Kds (inset) were determined by curve-fitting to [DP]/[Dt] = 1/(1 + (Kd/[P])). (D) CaMKII treatment inhibits Ets-1 DNA binding 50-fold. (Top) EMSA of Ets-1 treated with CaMKII without (mock-treated) or with (phosphorylated) unlabeled ATP. Reaction products were used in DNA-binding assays without repurification. (Bottom) Binding curves were generated from mean (±s.d.) of three EMSA performed as in top panel and analyzed as in C. (E) Ets-1 DNA-binding inhibition is reversed by phosphatase treatment. Phosphorylated, repurified Flag–Ets-1 was mock-treated or incubated with calf intestinal phosphatase (CIP). EMSA analysis was used to derive DNA-binding curves and equilibrium dissociation binding constants as in C.

