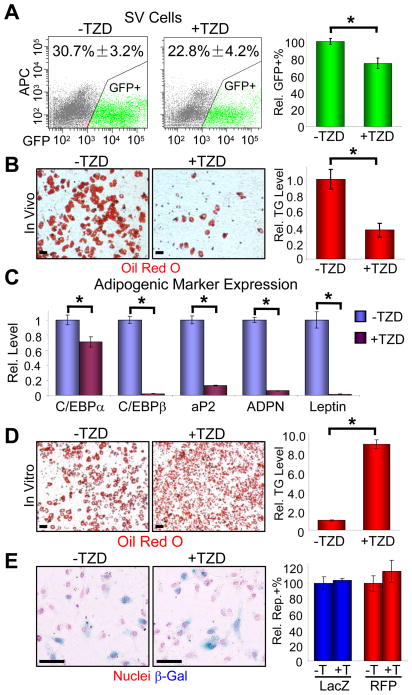
Figure 3. TZDs exhaust the progenitor pool.
(A–C) Adult AdipoTrak mice were treated with or without TZD for 2 months, and the adipose SV cells were analyzed for GFP (A) or sorted for GFP+ cells, plated in equal numbers, and cultured in insulin (B–C). (A) The percentages of GFP+ cells are as indicated at top of the flow profiles. X-axis is GFP intensity; Y-axis is APC channel to illustrate cell distribution. The relative percentages of GFP+ cells, compared to −TZD, are shown on the graph on the right. See also Figure S3. n = 4 per cohort (B–C) Adipogenesis was assayed with Oil Red O staining (left two panels (B), fat stains red), triglyceride quantification (graph on the right, (B)), and qPCR analyses of a panel of adipogenic markers (C). ADPN: adiponectin.
(D) SV cells from untreated AdipoTrak mice were isolated, cultured in insulin with or without TZD. Adipogenesis was assayed by Oil Red O staining (left two panels) and triglyceride quantification (right panel).
(E) AdipoTrak R26RlacZ or R26RRFP reporter mice were treated with or without TZD for 2 months, and adipose SV cells were examined for β-galactosidase by X-gal staining (left panels) and cell counting (2,500~5,500 cells, blue in the graph) or RFP with flow cytometry (red in the graph).
*p < 0.05 by two-tailed Student’s t-Test. Error bars indicate SEM. Scale bars: 50 μm (B, D, E)

