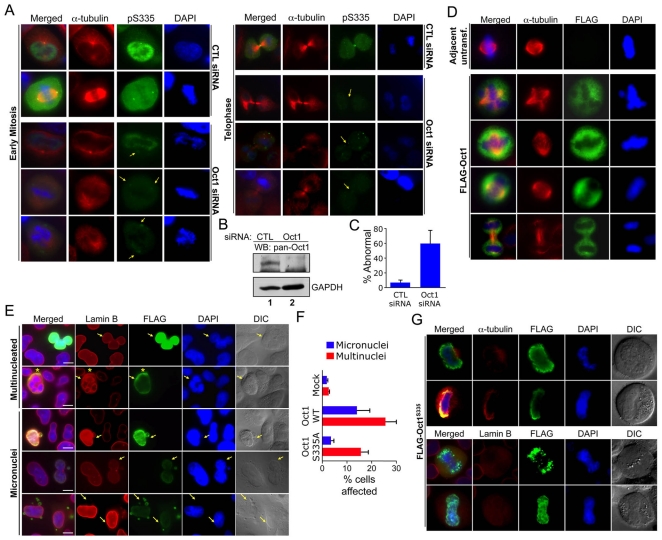
Figure 3. Modulation of Oct1 levels results in abnormal mitoses in HeLa cells.
(A) IF images are shown of HeLa cells transiently transfected with control or Oct1-specific siRNAs. Arrows indicate positions of disrupted spindle pole/midbody localization. Formaldehyde fixation was used. (B) Western blot showing effect of transfected control and Oct1-specific siRNA on total Oct1 expression in cycling cells. Cells were cultured for 72 hr prior to analysis. (C) Quantification of abnormal in HeLa cells treated with control and Oct1-specific siRNAs. Values represent averages from three independent experiments. Error bars depict standard deviations. (D) IF images of HeLa cells transiently transfected with FLAG-Oct1. Transfected cells were incubated for 48 hr prior to formaldehyde fixation and staining with anti-α-tubulin and anti-FLAG antibodies. Single mitotic cell images are shown. (E) IF images are shown of interphase HeLa cells transiently transfected with FLAG-tagged wild-type Oct1. Cells were stained with DAPI, and anti-FLAG and anti-lamin B (B1+B2) antibodies. Arrows indicate transfected cells. Asterisk indicates an area of specific Oct1 and lamin B co-localization. Example cells showing multinucleated cells and micronuclei are shown. Scale bars indicate 20 µM. (F) Quantification of the frequency of micronuclei and multinucleated cells in mock transfected, wild-type Oct1 transfected, and S335A transfected interphase HeLa cells. Error bars depict standard deviations. (G) Similar experiment as (E) using cells transiently transfected with an Oct1 S335A point mutant made using site-directed mutagenesis of the human cDNA. Top panels show mitotic HeLa cells stained with anti-FLAG and anti-α-tubulin antibodies. Bottom panels substituted lamin B antibodies.

