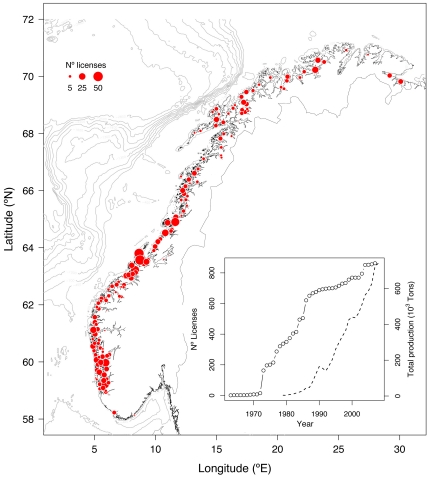
Figure 1. Map of the study area.
It shows the distribution of salmon farming along the Norwegian coast, where the size of the dots indicates the cumulative number of licenses (i.e. companies) registered to operate in each municipality up to 2007 (data from the Directorate of Fisheries). Note that a given license might operate in different municipalities. Note also that each dot is positioned by averaging the coordinates of all net pens installed in each municipality by each license. The inset shows the cumulative time trends of farming licenses (open dots) according to the registered year of starting activities (data from the Directorate of Fisheries), and the total farmed salmon production (broken line) in Norway (data from SSB).

