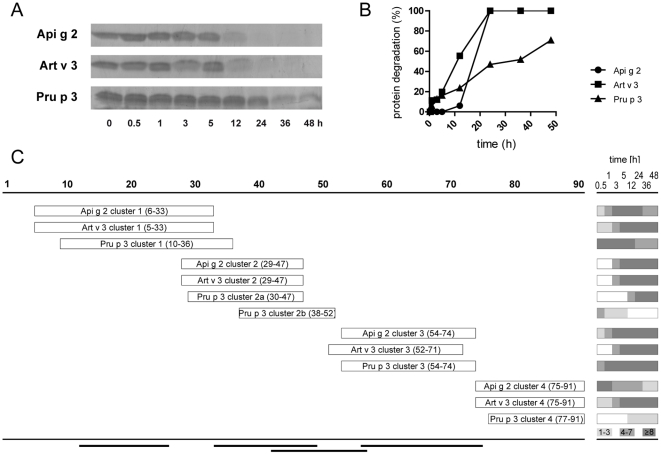
Figure 6. Simulated endolysosomal degradation of LTPs.
Celery, mugwort pollen and peach LTP were incubated with a microsomal fraction obtained from dendritic cells of LTP allergic patients. Decline of intact proteins was monitored on SDS-PAGE (A) and evaluated densitometrically (B). Mass spectrometry based analysis of peptides demonstrated distinct clusters at similar regions of the respective LTPs and amino acid positions are given in parenthesis (C). The panel on the right side shows the number of peptides (indicated by different grey shadings) observed for each cluster during endolysosomal digestion (0.5–48 hours). Black bars on bottom represent previously identified T cell epitopes of Pru p 3 [28], [29].

