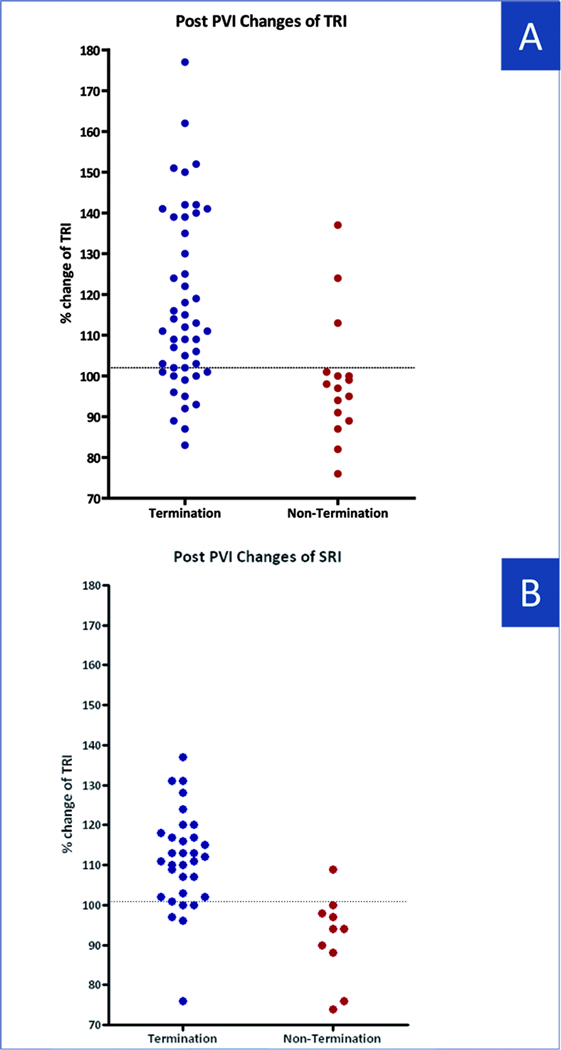
Figure 4.
Changes in Regularity Indexes after PVI as compared to Baseline Scatter plot of changes in TRI (A) and SRI (B) in patients with and without AF termination. Horizontal line indicates optimal diagnostic cutoff to predict AF termination. Same abbreviations as in Figure 1.

