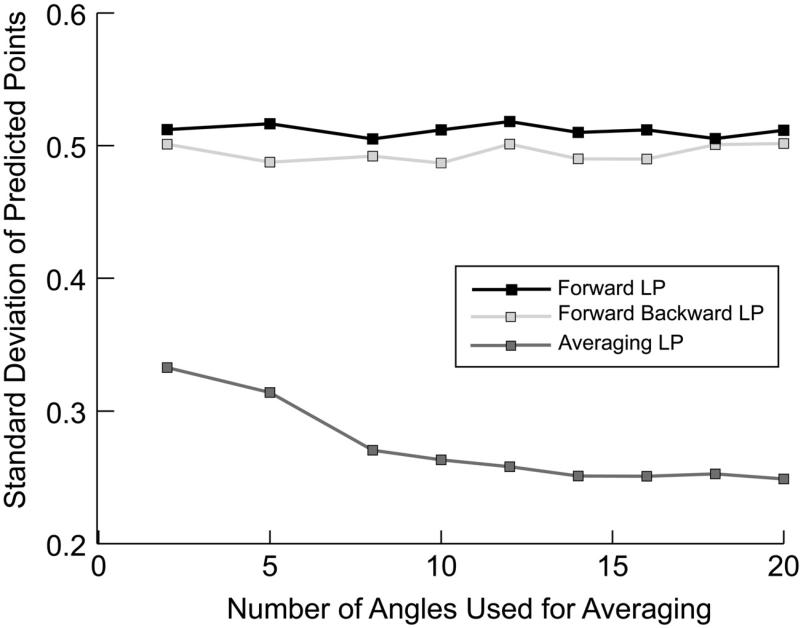
Fig. 2.
The improvement in linear prediction coefficient accuracy is assessed through generated data. A radial sampled data set was generated according to Eq. (1). The noise free data contained 10 peaks using 40 quaternion data points. This data set was truncated to 24 quarternion points and random noise was then added. Using 10 coefficients for each of forward, forward-backward or averaging linear prediction with an increasing number of angles, an additional 16 quarternion points were generated. The newly generated 16 points were compared to the noiseless points. The procedure was repeated to generate a standard deviation from the actual values, each time with varying random noise.

