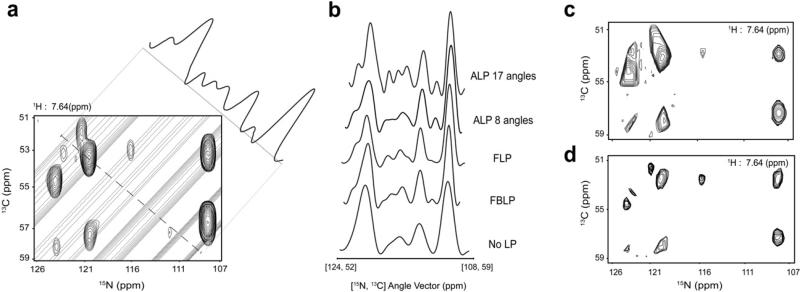
Fig. 3.
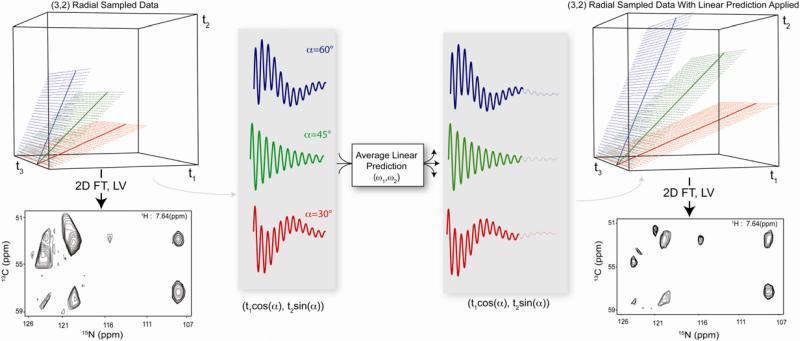
Demonstration of the advantage of averaged linear prediction in processing radial sampled NMR data. Panel A shows the two-dimensional indirect frequency plane of a linear predicted (ALP) radial sampled HNCA sampled at 25°. The equivalent peaks from the traditionally sampled Cartesian spectrum are overlaid to indicate the authentic intensity. The overlaid dashed line indicates the vector perpendicular to the artifact ridges, the intensity along which is indicated as a projection outside the spectrum. Panel B compares the same spectrum slice from each of the spectra processed with the noted type of linear prediction. It is clear that average linear prediction accurately increases the resolution of all of the peaks in the spectrum resolves all of the peaks in the spectra when 17 sampling angles are used. Panels C and D demonstrate the advantage of applying averaging linear prediction to generate a final spectrum using the lower value comparison. Panel C shows the indirect plane processed without any linear prediction while Panel D shows the equivalent plane processed with average linear prediction. In all cases the data was linear predicted from 24 quaternion data points to 40 quaternion points using 10 linear prediction coefficients.


