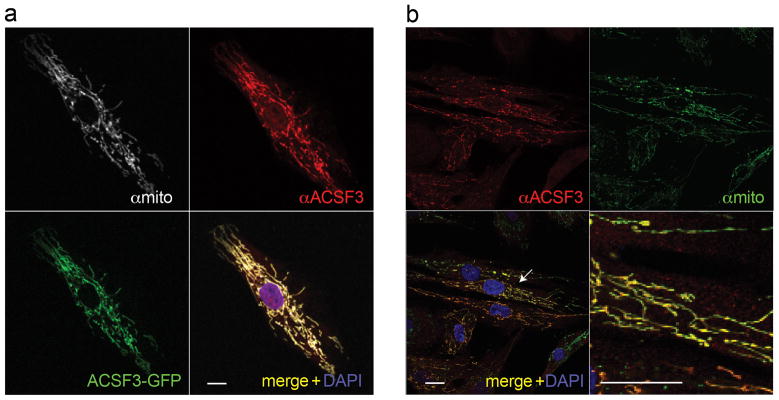
Figure 3.
ACSF3 mitochondrial localization. A) Control fibroblasts transfected with a plasmid expressing C-terminal GFP-tagged ACSF3 were co-stained with anti-ACSF3 (red) and a mitochondrial antibody (white). Scale bar=10 μm B) Fibroblasts from Subject 4 that express ACSF3 after lentiviral transduction were co-stained with anti-ACSF3 (red) and a mitochondrial antibody (green). The bottom right depicts an enlargement of the area surrounding the arrow. Scale bar=20 μm. All images were collected using a confocal microscope using a 63X objective with 0.7 zoom.

