Abstract
Saturation-recovery (SR) EPR at W-band (94 GHz) to obtain profiles of the membrane fluidity and profiles of the oxygen transport parameter is demonstrated for lens lipid membranes using phosphatidylcholine (n-PC), stearic acid (n-SASL), and cholesterol analogue (ASL and CSL) spin labels, and compared with results obtained in parallel experiments at X-band (9.4 GHz). Membranes were derived from the total lipids extracted from two-year-old porcine lens cortex and nucleus. Two findings are especially significant. First, measurements of the spin-lattice relaxation times T1 for n-PCs allowed T1 profiles across the membrane to be obtained. These profiles reflect local membrane properties differently than profiles of the order parameter. Profiles obtained at W-band are, however, shifted to longer T1 values compared to those obtained at X-band. Second, using cholesterol analogue spin labels and relaxation agents (hydrophobic oxygen and water-soluble NiEDDA), the cholesterol bilayer domain was discriminated in membranes made from lipids of the lens nucleus. However, membranes made from cortical lipids show a single homogeneous environment. Profiles of the oxygen transport parameter obtained from W-band measurements are practically identical to those obtained from X-band measurements, and are very similar to those obtained earlier at X-band for membranes made of two-year-old bovine cortical and nuclear lens lipids (M. Raguz, J. Widomska, J. Dillon, E. R. Gaillard, W. K. Subczynski, Biochim. Biophys. Acta 1788 (2009) 2380-2388). Results demonstrate that SR EPR at W-band has the potential to be a powerful tool for studying samples of small volume, ~30 nL, compared with the sample volume of ~3 μL at X-band.
Keywords: EPR, W-band, spin-label, eye lens, cholesterol, cholesterol bilayer domain
1. Introduction
The saturation-recovery (SR) EPR method was pioneered at the National Biomedical EPR Center in Milwaukee [1]. The X-band (9.4 GHz) SR spectrometer, which is equipped with a loop-gap resonator (LGR), has been significantly improved in recent years [2, 3]. Other EPR spectrometers built in the EPR Center allow SR measurements at microwave frequencies from 2 to 94 GHz [3, 4]. In previous papers [3–5], we showed that (1) the T1 values of water-soluble spin labels as well as lipid-type spin labels in membranes depend on microwave frequency (being longest at Q-band (35 GHz)), and (2) that the effect of collisions between oxygen and spin-labels on the measured T1 values are independent of frequency at all microwave frequencies.
Recently, we used EPR spin-labeling methods, including the SR approach, to study organization and dynamics of lens lipid membranes from different species (six-month-old calf and pig [6–8]), from animals of different ages (six-month-old and two-year-old cow [6, 7, 9], and from different eye regions (cortex and nucleus of a two-year-old cow [9]). These membranes are overloaded with cholesterol, which not only saturates phospholipid bilayers but also leads to the formation of cholesterol bilayer domains (CBDs) within the membrane [8, 9]. EPR spin-labeling methods provide a unique opportunity for determining the lateral organization of lens lipid membranes including coexisting membrane domains [10, 11]. They also provide a number of unique approaches for determining several important membrane properties as a function of bilayer depth including alkyl chain order [12], hydrophobicity [13], and oxygen diffusion-concentration product (called the oxygen transport parameter) [14]. In some cases, these properties can be obtained in coexisting membrane domains without the need for physical separation [10, 11]. EPR spin-labeling methods also make it possible to obtain molecular-level information on the organization and dynamics of cholesterol molecules in the CBD as well as information on physical properties of this domain [15]. This type of information cannot be obtained by differential scanning calorimetry (DSC) [16–18], X-ray, or neutron diffraction [16, 17, 19–21] methods, which also have been applied to investigate the lateral organization of lens lipid membranes and intact lens membranes.
All previous investigations were carried out at X-band using conventional and SR EPR spectrometers with an LGR that has a sample volume of 3 μL. To complete all measurements and obtain detailed profiles, lipids were extracted from 50 to 100 eye lenses. It is not difficult to obtain these numbers of similar eye lenses (age is the major criterion) from a meat-packing plant. Human lenses however are more precious and more difficult to obtain in these numbers from eye banks. A more serious problem is that human lenses can be different not only because of age, but also because of varying health history of the donor. The best solution of this problem will be to perform all measurements on samples prepared from one or two eyes from a single donor.
Here, we present results that demonstrate the feasibility of such measurements. Profiles of lens lipid membrane properties that were obtained using spin-label EPR at X-band with an LGR with a sample volume of 3 μL can also be obtained at W-band with the LGR with a sample volume of 30 nL. Thus, the total amount of sample can be 100 times smaller at W-band than at X-band. Results at W-band and X-band include profiles of the membrane fluidity and oxygen transport parameter, as well as data on discrimination of coexisting membrane domains. Additionally, results are reported about properties of two-year-old porcine cortical and nuclear membranes, which complement the published data describing properties of two-year-old bovine cortical and nuclear membranes [9], increasing our knowledge about organization and dynamics of lens lipid membranes from different species.
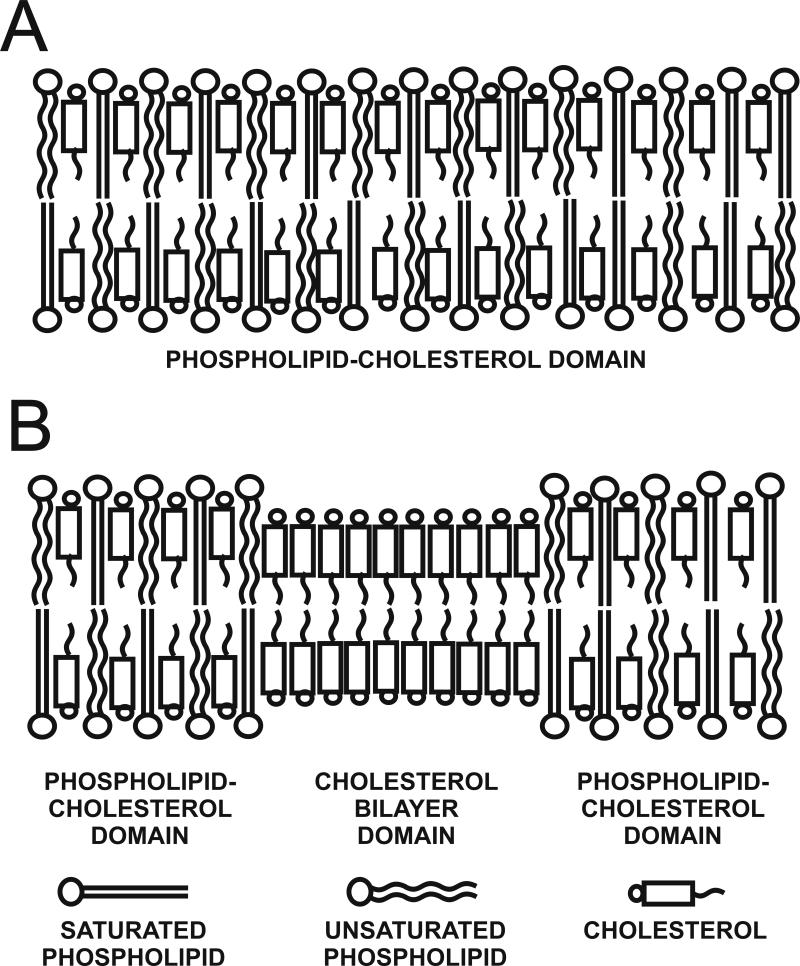
In these studies, phospholipid- and cholesterol-analogue spin labels (see Fig. 2 in Ref. [8] for structures and approximate localization in the lipid bilayer) are incorporated in the membrane with the nitroxide moiety, which gives rise to the observed EPR signal at specific depths and in specific membrane domains. These spin labels have molecular structures that are similar to parent phospholipids or cholesterol and therefore are expected to be similarly distributed across different membrane domains and to exhibit similar dynamics. Figure 1 is a schematic drawing showing structures of eye-lens lipid membranes: membranes that are close to saturation with cholesterol (Fig. 1A, lens lipid membranes from young animals and from lens cortex) and membranes that are overloaded with cholesterol (Fig. 1B, nuclear lens lipid membranes where bulk phospholipid-cholesterol domain (PCD) coexists with an immiscible pure cholesterol bilayer domain (CBD)). The phospholipid-type spin labels are expected to partition only into the bulk PCD. Thus, profiles obtained with the use of these spin labels should describe only properties of the PCD, without “contamination” from the CBD. The cholesterol-type spin labels should distribute between both domains and can detect and discriminate the PCD and the CBD (we direct readers to Ref. [11] for more details).
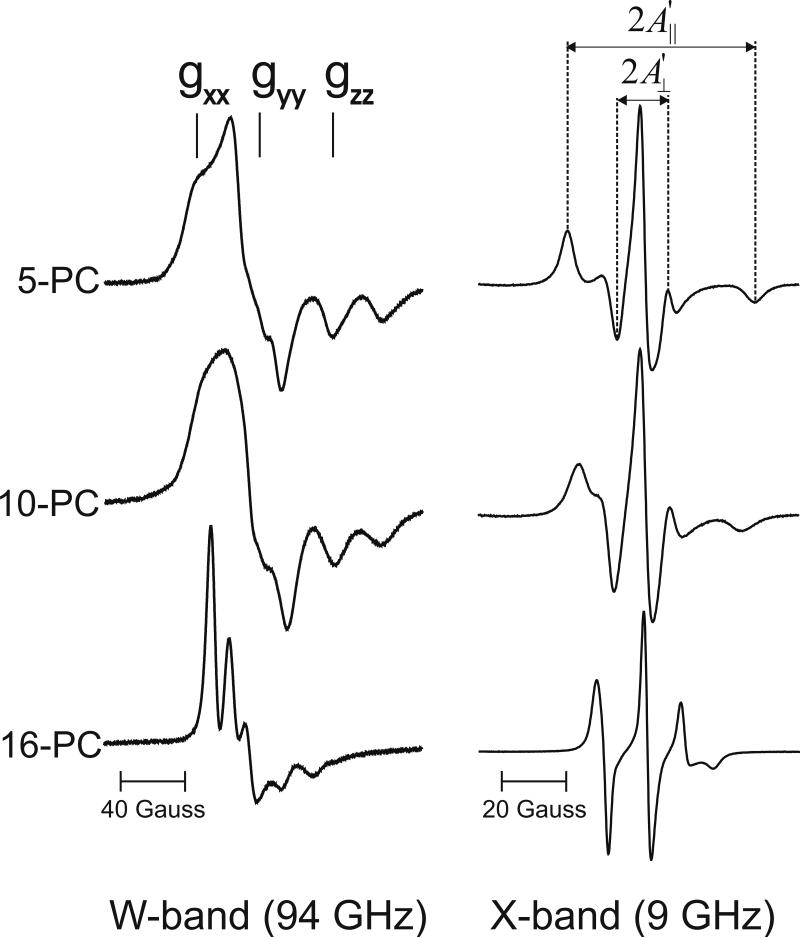
Fig. 2.
Panel of representative EPR spectra of phospholipid-type spin labels in cortical lens lipid membranes. Spectra were recorded at W-band and X-band at 25°C. gxx, gyy, and gzz are indicated to show effect of a high magnetic field on the position of these components at W-band.
Fig. 1.
Schematic drawing of the cortical lens lipid membrane which is formed by phospholipid bilayer saturated with cholesterol (PCD) (A), and the nuclear lens lipid membrane with the pure cholesterol bilayer domain (CBD) in the bulk PCD (B).
2. Materials and Methods
2.1. Materials
One-palmitoyl-2-(n-doxylstearoyl)phosphatidylcholine spin labels (n-PC , n = 5, 7, 10, 12, 14, or 16), tempocholine-1-palmitoyl-2-oleoylphosphatidic acid ester (T-PC), and cholesterol were obtained from Avanti Polar Lipids, Inc. (Alabaster, AL). 9-doxylstearic acid spin label (9-SASL) and cholesterol analogues, androstane spin label (ASL) and cholestane spin label (CSL) were purchased from Molecular Probes (Eugene, OR). Other chemicals, of at least reagent grade, were purchased from Sigma-Aldrich (St. Louis, MO).
2.2. Isolation of the total lipids from the cortical and nuclear fiber-cell membranes of the porcine eye lenses
Fresh porcine eyes from two-year-old animals were obtained on the day of slaughter from Johnsonville Sausage, LLC (Watertown, WI). The eyes were dissected, and the lenses from about 100 eyes collected. Each lens was frozen on a block of dry ice, and when hardened, the nucleus was removed with cork borer. Each of the ca. 1 mm ends of the bored-out nucleus was sliced off with a razor blade and discarded. This method has been described previously [22]. The total lipids either from the nuclear plugs or from the cortex samples were extracted separately based on minor modifications of the Folch procedure [23]. The tissue samples were gently mashed in a 500 mL Erlenmeyer flask with the pestle from a tissue homogenizer to which ca. 200 mL of methanol/chloroform (2:1 v:v) mixture was added, and the slurry was stirred for 30 min. The sample was distributed to Corex centrifuge tubes obtained from Corning Inc. (Corning, NY) and centrifuged at 5000 rpm for 30 min. The supernatants were poured into a separatory funnel, and water and methanol were added so that the final ratio of methanol/chloroform/water was 2:1:1 (v/v). The chloroform layer was removed and the water layer was extracted two more times with chloroform. The chloroform layers were pooled, dried with MgSO4, filtered, and the solvent was removed. The resultant lipid samples were soft, white solids. They were stored at –20°C.
2.3. Preparation of lipid bilayer membranes
The membranes used in this work were multilamellar dispersions (multilamellar liposomes) made either from the lipid extract from eye-lens cortex or from the nucleus containing 1 mol% spin label. The membranes were prepared as described earlier [9]. Multilamellar liposomes are preferred in EPR investigations because the loose pellet after centrifugation contains a high amount of membranes (~20% lipids w/w), which significantly increases the signal-to-noise ratio.
2.4. EPR measurements
The membranes were centrifuged briefly, and the loose pellet was used for EPR measurements. For EPR measurements at X-band, samples were transferred to a capillary made from the gas-permeable methylpentene polymer known as TPX (i.d. 0.6 mm) [24]. Samples were equilibrated directly in the resonator with nitrogen or a mixture of nitrogen and air adjusted with a flowmeter (Matheson Gas Products, model No. 7631 H-604) [24, 25]. The same gas was used for temperature control. Conventional EPR spectra were obtained with a Bruker EMX X-band spectrometer with temperature control accessories. The X-band SR EPR spectrometer used in these studies has been described previously [2, 3].
At W-band, samples were equilibrated with either nitrogen or air at room temperature outside the resonator, transferred to a quartz capillary (i.d. 0.15 mm), and positioned in the resonator of the W-band spectrometer, which is equipped with a temperature-control system. Spectrometer and LGR used for W-band measurements, including its SR capabilities, were described earlier [4, 26].
The spin-lattice relaxation times, T1s, of the spin-labels were measured using SR capabilities of X-band, and W-band EPR spectrometers. They were determined by analyzing the SR signal of the central line (X-band) and the low-field line (W-band) obtained by short-pulse SR EPR. At W-band, the low-field hyperfine line is most intense, while at X-band, the central line is most intense (Fig. 2). For lipid spin labels in membrane suspensions, the pulse duration was 0.3–1 μs. For these samples, motion of spin labels was sufficiently slow that the nitrogen nuclear relaxation times were shorter than the electron T1 values; resulting in strong coupling of the three hyperfine lines (see also Sect. 2.3 in Ref. [5]).
2.5. SR data acquisition and processing
Typically, 106 decays were averaged, half of which were off-line and differenced for baseline correction, with 2048 (X-band) and 1024 (W-band) data points per decay. Sampling intervals depended on sample, temperature, oxygen tension, and microwave frequency, and were from 1 to 40 ns. Total accumulation times were about 2–5 min. Recovery curves were fitted by single, double, and triple exponentials, and compared. Fits were based on a damped linear least-squares method, which utilizes the Gauss-Newton minimization procedure and includes a scalar factor. This factor helps to “damp” the process toward the minimum and assures convergence in the iterative steps. The damped least-squares method has proven successful for fitting exponential decay curves [27] and EPR spectra [28].
The major criteria for the goodness of the fit of the SR signals are the residual (the experimental signal minus the fitted curve) and the standard deviation. If substantial improvement in the fitting is not observed when the number of exponentials is increased from one, the SR signal can be analyzed as a single exponential. This is often the case for samples equilibrated with nitrogen (see Sect. 3.2). For samples containing membrane domains and in the presence of relaxation agents (oxygen or NiEDDA), fitting the experimental data to a single-exponential mode is often unsatisfactory, while a double-exponential fit can be excellent (good residual and smaller standard deviation; see Sect. 3.4), which is consistent with the existence of two immiscible domains. Additional criteria for the goodness of a fit are the pre-exponential coefficient for the second component (negligible for a single-exponential fit and significant [~5% or larger] for a double-exponential fit), the standard deviation of T1 for the second component (when this value is much larger than for the first component, it is a sign that a single-exponential fit is satisfactory; when values are comparable, a double-exponential fit can be satisfactory), and the consistency of the fit for different recording conditions such as number of points and time increment.
Results indicated that for all of the recovery curves obtained in this work for phospholipid-type spin labels, no substantial improvement in the fitting was observed when the number of exponentials was above one, establishing that recovery curves can be analyzed as single exponentials. For cholesterol-type spin labels in the presence of relaxation agents (for ASL in the presence of oxygen and for CSL in the presence of NiEDDA) only the double exponential fit was satisfactory. Decay time constants were determined with accuracy better than +/–3%. Although, the sensitivity in terms of number of spins required for good SR signals increases markedly with increase in microwave frequency, the concentration sensitivity of SR of spin-labels has been found to be substantially independent of microwave frequency (see Ref. [5] where the concept of SR concentration sensitivity is discussed, and also see captions to Figs. 4 and 7).
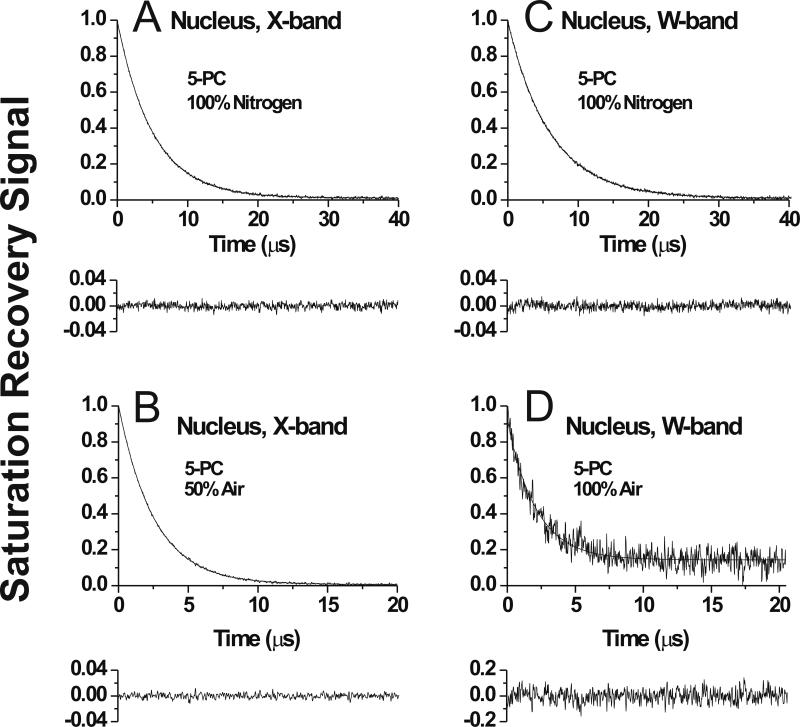
Fig. 4.
Representative SR signals with fitted curves and the residuals (the experimental signal minus the fitted curve) for 5-PC in membranes made of nuclear porcine lens lipids. Signals were recorded at X-band (A,B) and at W-band (C,D) at 25°C for samples equilibrated with 100% nitrogen gas (A,C), with a gas mixture of 50% air and 50% nitrogen (B), and with 100% air (D). SR signals for 5-PC were satisfactorily fitted to a single exponential function in both the absence and presence of molecular oxygen at X-band with time constants of, 4.90 ± 0.01 μs (A), and 2.56 ± 0.01 μs (B) and at W-band with time constants of, 6.00 ± 0.01 μs (C), and 1.92 ± 0.02 μs (D). The major criterion for the goodness of a fit is the residual, indicating that single exponential fits for all signals are excellent. Equilibration with 100% air significantly shortened the T1 value and the available pump power cannot saturate the signal. Both factors contribute to the lower signal-to-noise ratio at D (accumulation time was kept the same). Additional criteria for the goodness of single and double-exponential fits are explained in Sect. 2.5 and Ref. [10].
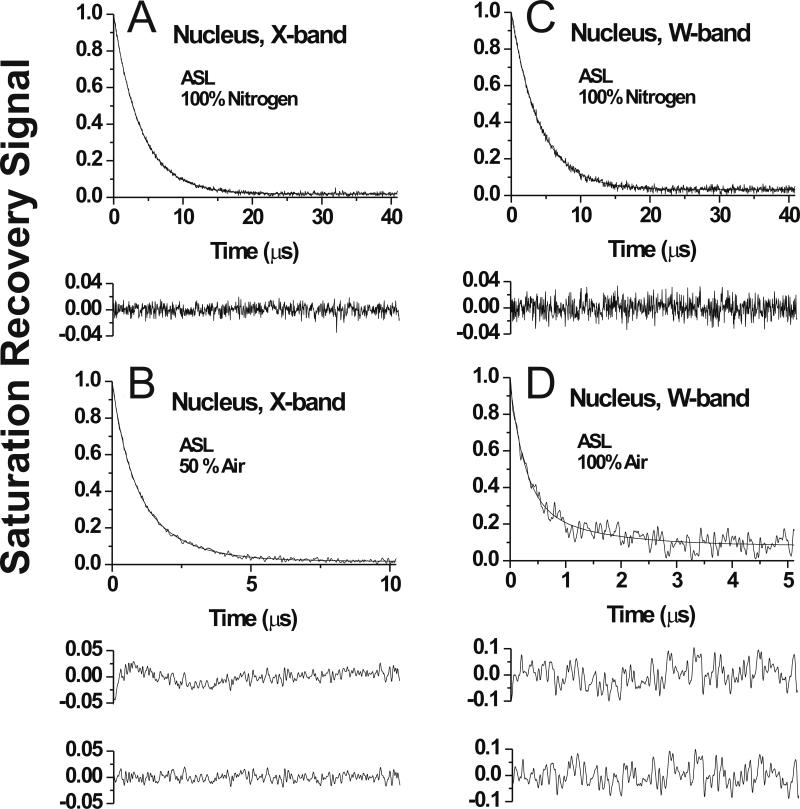
Fig. 7.
Representative SR signals with fitted curves and the residuals (the experimental signal minus the fitted curve) for ASL in membranes made of nuclear porcine lens lipids. Signals were recorded at X-band (A,B) and at W-band (C,D) at 25°C for samples equilibrated with 100% nitrogen gas (A,C), with a gas mixture of 50% air and 50% nitrogen (B), and with 100% air (D). SR signals in nuclear membranes were satisfactorily fitted to a single exponential function in the absence of molecular oxygen at X-band with time constants of 3.91 ± 0.01 μs (A) and at W-band with time constants of 4.10 ± 0.01 μs (C). The SR signal in the presence of molecular oxygen can be fitted satisfactorily with a double exponential curve in the nuclear membrane at X-band with time constants of 2.32 ± 0.31 μs and 0.70 ± 0.01 μs (B) and at W-band with time constants of 1.67 ± 0.28 μs and 0.41 ± 0.02 μs (D) (compare the upper residual for single and lower residual for double exponential fit in B and D). Equilibration with 100% air significantly shortened the T1 value and the available pump power cannot saturate the signal. Both factors are the reason of the worth signal-to-noise ratio at D (accumulation time was kept the same).
3. Results and Discussion
3.1. Conventional EPR spectra
In Fig. 2, EPR spectra of selected spin labels obtained at W- and X-band for cortical lens lipid membranes are presented. Shapes of spectra indicate that phospholipid bilayers of these membranes contain high (saturating) amounts of cholesterol. This is clearly seen for the high-field component of the spectrum of 16-PC, both at X- and W-band. The shape of this line is similar to the shape of the high field component of 7- or 10-PC in membranes without cholesterol (data not shown). The anisotropic rotational motion of n-PC or n-SASL gives rise to the unique features of the EPR spectra at X-band that allow calculation of the order parameter of the alkyl chain using spectral parameter (A∥ and A⊥) measured directly from the spectra (Fig. 2) and Eq. 1 [12, 29]:
| (1) |
The order parameter is a measure of the amplitude of the wobbling motion of the segment of the alkyl chain to which the nitroxide moiety is attached. Increase in order parameter indicates that the angle of the cone, responsible for the wobbling motion of the alkyl chain, decreases. Moreover, as the spin label is moved from the bilayer surface to the membrane interior, deviations in the alkyl chain segment direction from the bilayer normal accumulate. Thus, ordering of the alkyl chain close to the membrane surface (induced, for example, by contact with the plate-like portion of cholesterol), also causes an apparent ordering of the distal fragment of the alkyl chain [2]. Although the order parameter indicates an amplitude of wobbling motion of alkyl chains in the lipid bilayer, the change in the order parameter is most often described as a change in spin-label mobility, and thus as a change in membrane fluidity. This easy approach cannot be applied to analyze the EPR spectra at W-band. Only with some restrictions can the ordering potential and rotational diffusion coefficient be obtained by computer simulation of W-band EPR spectra [30–33]. These simulations were not performed here.
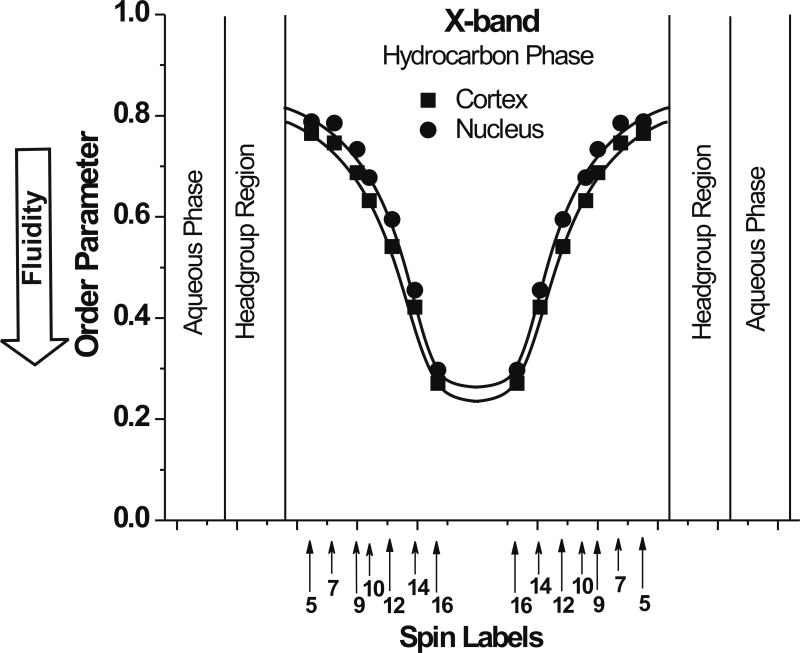
In Fig. 3, profiles of the order parameter calculated from EPR spectra of phospholipid spin labels recorded at X-band for cortical and nuclear membranes are presented. Because of the localization of phospholipid-type spin labels in the PCD; these profiles reflect properties of this domain in cortical and nuclear membranes. Profiles are practically identical and very similar to the profiles across PCDs of other lens lipid membranes [8, 9]. Since the phospholipid composition of the cortical and nuclear regions of the eye lens differ significantly [34–37], these results support our hypothesis [8, 9] that properties of lens lipid membranes, because of saturation with cholesterol, are very similar independently of differences in phospholipid composition.
Fig. 3.
Profiles of the molecular order parameter at 25°C obtained with n-PC and 9-SASL across cortical and nuclear porcine lens lipid membranes. Approximate locations of nitroxide moieties of the spin labels are indicated by arrows.
3.2. T1 measurements and profiles of membrane fluidity
Figure 4 shows representative SR signals of 5-PC in nuclear lens lipid membranes recorded at 25°C at X-band and W-band. Measurements performed for deoxygenated samples at X-band and W-band indicate that the SR signals from 5-PC (Fig. 4A and C) and from all other phospholipid-type spin labels are satisfactorily fit to a single exponential function. SR measurements were carried out systematically as a function of the location of the nitroxide moiety of spin labels at different depths in the membrane. The unique distribution of the phospholipid-type spin labels (n-PC and 9-SASL) in lens lipid membranes and their exclusive localization only in the PCD ensure that profiles of membrane properties obtained with these spin labels describe only properties of the PCD without contamination from the CBD (see Fig. 1B and Ref. [8]).
As was indicated in Sect. 3.1, the order parameter describes the amplitude of the wobbling motion. We proposed earlier [11] that T1 measured in deoxygenated samples can be used as a convenient measure of membrane fluidity. This parameter depends primarily on the rate of rotational motion of the nitroxide moiety within the lipid bilayer [38, 39]. Thus, T1 can be used as a convenient quantitative measure of membrane fluidity, indicating the motion of phospholipid alkyl chains (or nitroxide free-radical moieties attached to those chains). We showed earlier that T1 can reveal cholesterol-induced changes in membrane fluidity that cannot be differentiated by profiles of the order parameter [2]. We found that both the order parameter and T1 indicated that cholesterol has a rigidifying effect on alkyl chains that reach to the depth occupied by the rigid steroid-ring structure. At deeper locations, cholesterol also causes an increase of the order parameter (see Sect. 3.1). However, T1 values measured in the presence of cholesterol are shorter, which indicates a greater rate of motion of nitroxide moieties attached to alkyl chains. This confirms the uniqueness and usefulness of the fluidity profiles obtained from T1 measurements.
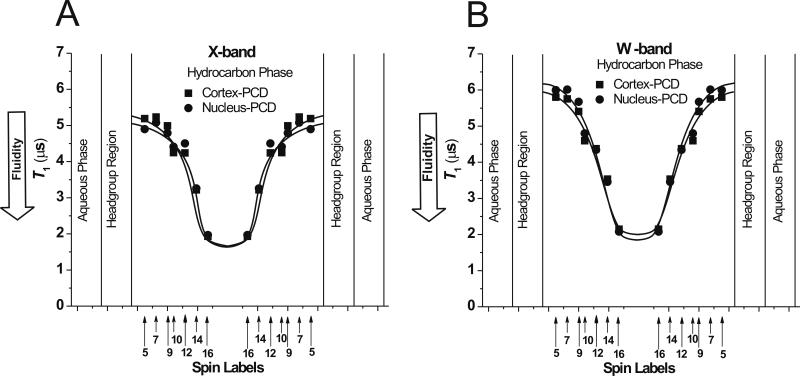
In Fig. 5, the fluidity profiles (T1 versus depth in the membrane) for the PCD of cortical and nuclear membranes obtained at X- and W-band are presented. As expected, membrane fluidity increases toward the membrane center. The profiles for the cortical and nuclear lens lipid membranes cannot be distinguished when measured either at X- or W-band. Profiles obtained at W-band are shifted to the longer values of T1, which is in agreement with our earlier results on the effect of microwave frequency on measured T1 values [4, 5]. These profiles characterize dynamic properties of the alkyl chain that change gradually with membrane depth. Profiles of hydrophobicity (determined by the extent of water penetration into the membrane [14, 25]) and the oxygen transport parameter (membrane fluidity that reports on translational diffusion of molecular oxygen [6–9, 14, 40]) show abrupt change between C9 and C10 positions in the presence of saturating amount of cholesterol (see also Sect. 3.3 and Fig. 6). The spin-lattice relaxation time of the phospholipid-type spin labels is a convenient measure of membrane fluidity that can be easily obtained at W-band. Profiles of the membrane fluidity obtained at X- and W-band contain the same information about membrane dynamics. We discussed similarities and differences of information that can be extracted from the order parameter profiles and fluidity profiles (T1 versus depth in the membrane) earlier [11].
Fig. 5.
Profiles of the electron spin-lattice relaxation time, T1, for n-PC spin labels at 25°C across cortical and nuclear porcine lens lipid membranes recorded at X-band (A) and at W-band (B). Approximate locations of nitroxide moieties of spin labels are indicated by arrows.
Fig. 6.
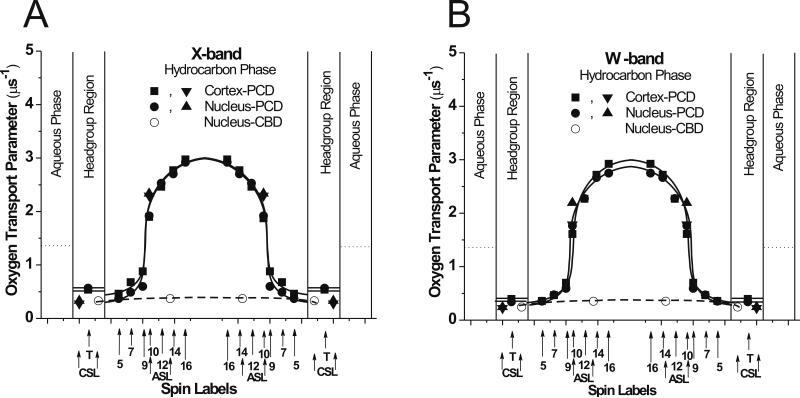
Profiles of the oxygen transport parameter (oxygen diffusion-concentration product) at 25°C across certain domains in cortical and nuclear porcine lens lipid membranes obtained at X-band (A) and W-band (B). Dotted lines indicate the oxygen transport parameter in the aqueous phase. Approximate localizations of nitroxide moieties of spin labels are indicated by arrows. Points obtained for phospholipid-type spin labels are indicated as ■ and ●, and points obtained for cholesterol-type spin labels are indicated as ▼, ◀, and ○. Two arrows for ASL and CSL indicate locations of these spin labels in the PCD and the CBD (see Ref. [9] for information about the location of nitroxide moieties of ASL and CSL in the PCD and the CBD).
3.3. The oxygen transport parameter and profiles of the oxygen transport parameter
The rate of bimolecular collision between the nitroxide moiety of a lipid-type spin label placed at a specific location in the membrane and molecular oxygen is a useful metric of membrane fluidity that reports on translational diffusion of oxygen molecules [14]. This rate can be expressed in terms of the oxygen transport parameter defined by Eq. (2):
| (2) |
where T1 values are the spin-lattice relaxation times of the nitroxide in samples equilibrated with atmospheric oxygen and nitrogen, respectively. W(x) is proportional to the product of the local translational diffusion coefficient D(x) and the local concentration C(x) of oxygen at a “depth” x in the lipid bilayer that is in equilibrium with atmospheric oxygen at normal atmospheric pressure. The oxygen transport parameter was used to characterize the three-dimensional dynamic structure of lipid bilayer membranes giving unique information about lateral organization and depth dependent properties [10, 40–42]. We applied this method to study the properties of lens lipid membranes from different species, from animals at different ages, and from different eye regions [6–9]. All of these SR measurements, including detailed profiles of the oxygen transport parameter, were performed at X-band using the LGR with a sample volume of ~3 μL. The results of our recent papers [3–5] allowed us to conclude that the oxygen transport parameter is independent of microwave frequency from 2 to 94 GHz. Thus, profiles of the oxygen transport parameter are obtained at W-band using the LGR with a sample volume of ~30 nL, which is 100 times smaller than the sample volume used at X-band, and are identical to profiles obtained at X-band.
Figure 4 shows representative saturation-recovery curves of 5-PC in nuclear lens lipid membranes recorded for samples equilibrated with 50 and 100% air. At both microwave frequencies (X-band and W-band), the saturation recovery signals from 5-PC (Fig. 4B and D) and from other phospholipid-type spin labels were satisfactorily fit to a single exponential function also in the presence of oxygen. Saturation-recovery measurements at X- and W-band, carried out systematically as a function of the location of spin labels in the membrane for samples in the presence and absence of oxygen, yielded profiles of the oxygen transport parameter across the PCD of cortical and nuclear lens lipid membranes. These profiles are shown in Fig. 6.
Major conclusions which can be made based on profiles obtained at X-band (Fig. 6A) are as follows. Profiles across the PCD of cortical and nuclear lens lipid membranes of the two-year-old pig are identical. They are practically identical with profiles across the PCD of cortical and nuclear lens lipid membranes of the two-year-old cow [9] and across lens lipid membranes of young, six-month-old cow and pig [6, 8]. This confirms our earlier statement that profiles of lens lipid membrane properties across membranes saturated with cholesterol cannot be distinguished and are independent of the membrane phospholipid composition. The oxygen transport parameter in the PCD of cortical and nuclear lens lipid membranes measured from the membrane surface to the depth of the ninth carbon (this is the depth to which the rigid steroid ring structure of the cholesterol is immersed into the bilayer) is as low as in gel phase membranes. The oxygen transport parameter in membrane centers (between tenth carbons) is as high as in fluid phase membranes without cholesterol. The most interesting feature of these profiles is that this very large change of the oxygen transport parameter occurs within one C-C bond distance between C9 and C10. The most significant result of these measurements is that profiles of the oxygen transport parameter obtained at W-band (Fig. 6B) are substantially identical to those obtained at X-band (Fig. 6A). Thus, conclusions based on measurements at X-band can also be made based on oxygen transport parameter profiles obtained at W-band, which confirms usefulness of the W-band in our future measurements.
3.4. Discrimination of membrane domains
In an analogy to the oxygen transport parameter defined in Eq. (1), the relaxation agent accessibility parameter, P(x), for a water soluble relaxation agent NiEDDA was defined by Eq. (3):
| (3) |
Greater P(x) values indicate a greater extent of NiEDDA penetration into the membrane. Accessibility measurements should be performed using deoxygenated samples. 20 mM is the NiEDDA concentration in buffer used for liposome preparations [15].
Collisions with molecular oxygen (Eq. (2)), which can be quite different in different domains, form the basis of the discrimination by oxygen transport (DOT) method [10, 41, 42]. Measurement of collisions with the water-soluble, paramagnetic nickel complex, NiEDDA (Eq. (3)), which penetrates differently into different membrane domains, also allows discrimination between domains. Both methods are used here to detect and characterize coexisting domains in lens lipid membranes using SR at X-band and W-band.
Figures 7 and 8 form the basis for determining whether or not the CBD is formed within the nuclear lens lipid membranes. For these measurements, we used cholesterol analogue spin labels ASL and CSL, which partition into PCD and CBD (Fig. 1B), and are able to discriminate coexisting domains using oxygen or NiEDDA as relaxation agents. Figure 7 describes experiments with the hydrophobic relaxation agent oxygen, showing SR signals for ASL in nuclear lens lipid membranes equilibrated with nitrogen and 50% (X-band) or 100% (W-band) air. The single-exponential fit is satisfactory for deoxygenated samples in the nuclear membranes. However, in the presence of oxygen, for the nuclear membrane the SR signal for ASL was a double-exponential. The shorter time constant in the nuclear membrane was similar to the time constant obtained in the cortical membrane (data not shown), and this SR signal were assigned to the bulk PCD. The longer time constant in the nuclear membrane was assigned to the CBD (see also Refs. [8, 9]). All SR signals obtained with CSL for membranes in the presence of oxygen were single exponentials (data not shown)). Because CSL and cholesterol should partition similarly into the PCD and the CBD (see paragraph below), we conclude that the collision rate between oxygen and the nitroxide moiety of CSL is the same in the PCD and CBD.
Fig. 8.
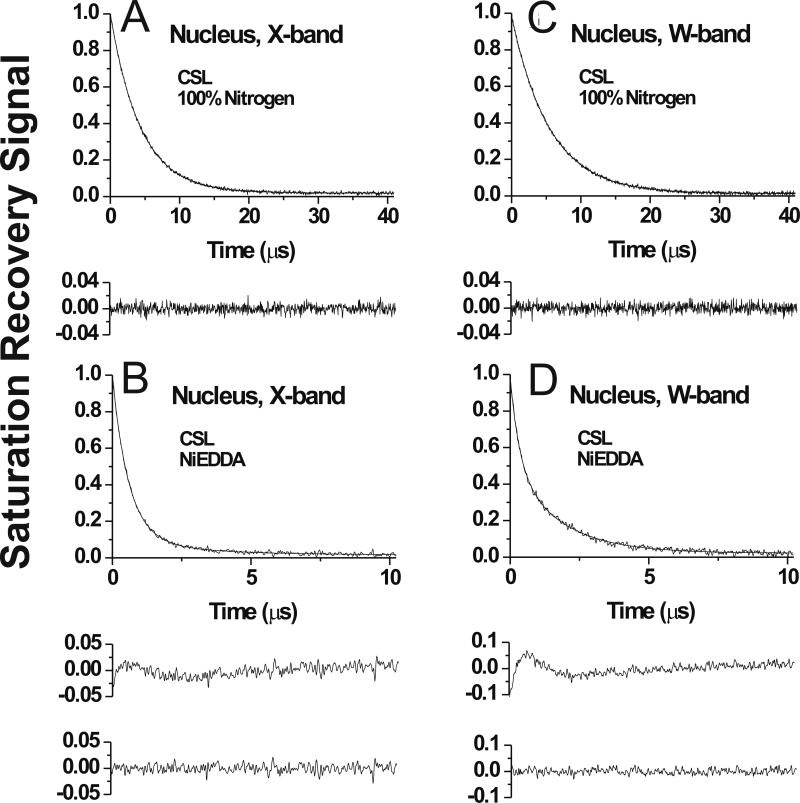
Representative SR signals with fitted curves and the residuals (the experimental signal minus the fitted curve) for CSL in membranes made of nuclear porcine lens lipids. Signals were recorded at X-band (A,B) and at W-band (C,D) at 25°C for samples equilibrated with 100% nitrogen gas without (A,C) and in the presence of 20 mM NiEDDA in the buffer (B,D). SR signals in nuclear membranes were satisfactorily fitted to a single exponential function in the absence of NiEDDA at X-band with time constants of 4.36 ± 0.01 μs (A) and at W-band with time constants of 5.50 ± 0.01 μs (C). The SR signal in the presence of NiEDDA can be fitted satisfactorily with a double exponential curve in the nuclear membrane at X-band with time constants of 1.7 ± 0.2 μs and 0.6 ± 0.02 μs (B) and at W-band with time constants of 1.93 ± 0.2 μs and 0.71 ± 0.02 μs (D) (compare the upper residual for single and lower residual for double exponential fit in B and D).
X- and W-band oxygen transport parameter values for ASL and CSL have been used to draw the approximate profile of the oxygen transport parameter across the CBD coexisting with the bulk PCD in the nuclear membranes (Fig. 6). Values of the oxygen transport parameter in the CBD are very low, five times smaller than in water and ten times smaller than in center of the PCD. Also, oxygen transport parameter values for ASL and CSL obtained at X- and W-band in the PCD have been added to the profile across the PCD obtained with phospholipid-type spin labels in cortical and nuclear membranes (Fig. 6). These data confirm assignment of the results for SR measurements with ASL in nuclear membranes. They also confirm that the nitroxide moiety of ASL is located in the PCD at a depth that is similar to the nitroxide moiety of 10-PC, and that the nitroxide moiety of CSL is located in the polar headgroup region. See Refs. [8, 9] for more detail about locations of nitroxide moieties of ASL and CSL in PCD and CBD.
Figure 8 describes X-band and W-band experiments with the water soluble relaxation agent NiEDDA, showing SR signals for CSL in deoxygenated nuclear lens lipid membranes in the absence and presence of 20 mM NiEDDA in the buffer. The single-exponential fit was satisfactory for samples in the absence of NiEDDA. In the presence of NiEDDA CSL also showed the single SR signal for the cortical membranes (data not shown). However, for the nuclear membrane the SR signal was a double-exponential. The longer time constant in the nuclear membrane was similar to the time constant obtained in the cortical membrane, and these SR signals were assigned to the bulk PCD. The shorter time constant in the nuclear membrane was assigned to the CBD (see also Ref. [15]). The nitroxide moiety of CSL is more exposed to collisions with water soluble NiEDDA when CSL is located in the CBD and the nitroxide moiety is not protected by the umbrella effect of phospholipid headgroups, as in the PCD (Fig. 1B). These measurements also confirmed that CSL partitions into PCD and CBD. All SR signals obtained with ASL for membranes in the presence of NiEDDA were single exponentials (data not shown), which is in agreement with the fact that NiEDDA practically does not penetrate to the depth at which the nitroxide moiety of the ASL is located, both in the PCD and the CBD [15].
The NiEDDA accessibility parameter values (see Eq. (2)) obtained at X- and W-band for cortical membranes (PCD) were 0.30 μs-1 and 0.28 μs-1, respectively. The NiEDDA accessibility parameter values obtained at X- and W-band for PCDs of nuclear membranes were 0.36 μs-1 and 0.34 μs-1, and for the CBDs of nuclear membranes, 1.43 μs-1 and 1.24 μs-1, respectively. We note that the NiEDDA accessibility parameter value obtained in the CBD (which is the immiscible pure cholesterol bilayer) of the nuclear membrane is very similar to the value of 1.30 μs-1 obtained in the CBD in a simple POPS/cholesterol model membrane oversaturated with cholesterol [15].
In the present study, we were able to discriminate and characterize the immiscible CBD within the bulk phospholipid-cholesterol membrane of the eye lens nucleus. This was possible because of the application of the SR EPR discrimination method with the use of hydrophobic oxygen and water-soluble NiEDDA relaxation agents. This method has already been successfully used at X-band for detection and characterization of coexisting domains in membranes [8, 9, 15, 40–42]. Here, Figs. 7 and 8 contain SR data obtained in parallel experiments at X- and W-band, showing that coexisting membrane domains can be discriminated and characterized through SR experiments at W-band. We conclude that the SR EPR discrimination method is independent of microwave frequency for both hydrophobic oxygen and water-soluble NiEDDA relaxation agents. The significant, and positive, difference between experiments at X- and W-band is that the sample volume at W-band is about 100 times smaller than at X-band. This conclusion is summarized in Fig. 6B where profiles of the oxygen transport parameter in coexisting domains (PCD and CBD) are drawn based on SR EPR measurements at W-band with an LGR with a sample volume of 30 nL.
4. Conclusions
New capabilities in measurement of the spin-lattice relaxation time and oxygen transport parameter using SR EPR at W-band have been demonstrated in biological samples, namely, lens lipid membranes isolated from the cortical and nuclear region of the two-year-old porcine eye. Results demonstrate that SR EPR and spin-label oximetry at W-band have the potential to be powerful tools for studying samples of small volume, ~30 nL. Such capability could be essential to obtaining detailed T1 profiles across lens lipid membranes derived from human eyes from a single donor.
We also demonstrated that SR EPR discrimination methods with the use of either molecular oxygen or NiEDDA as relaxation agents, which were developed and successfully used at X-band to distinguish and characterize coexisting membrane domains, can also be used without restriction at W-band. Other benefits, including longer values of T1, a new technique for canceling free induction decay signals, a higher resonator efficiency parameter, a low resonator Q, and the ability to use high observing power in SR EPR measurements, were previously discussed [5].
New results which include profiles across cortical and nuclear lens lipid membranes derived from eye lenses of a two-year-old pig complement our studies on organization and dynamics of lens lipid membranes from different species and different eye lens regions [6–9]. Profiles across cortical and nuclear porcine and bovine lens lipid membranes were similar [9]. These profiles were also similar to those for membranes derived from six-month-old calf and pig lens lipids [6, 8] although in nuclear lens lipid membranes the CBD was discriminated.
The data presented here support of our hypothesis that the high cholesterol content keeps the bulk physical properties of the membrane relatively constant even with age-related changes in phospholipid composition. Properties of cortical and nuclear lens lipid membranes from the two-year-old porcine eye (profiles of the order parameter, fluidity, and the oxygen transport parameter) are very similar. Thus, independently of differences in lens lipid composition (phospholipid composition of cortical and nuclear membranes differ significantly, which also reflects age-related changes), properties of membranes are very similar. The presence of the CBD ensures that the surrounding phospholipid bilayer is saturated with cholesterol. These data provide improved understanding of the function of cholesterol and CBD in eye lens membranes.
We also would like to stress the significance of the discrimination of the CBD in lens lipid membranes that are observed using the SR EPR spin-labeling methods. In a recent paper [15], we indicated that the structures detected by EPR spin-labeling methods in model membranes when the cholesterol content exceeds the cholesterol solubility threshold, are pure cholesterol bilayer domains (CBDs). These structures are different from those observed using differential scanning calorimetry [16–18] and X-ray or neutron diffraction [19–21]. These papers report structures exhibiting the same properties as those found in one of three previously characterized triclinic crystal structures (formed without phospholipids) depending on the state of hydration and temperature.
Highlights.
Fluidity and oxygen transport parameter profiles for lens membranes at W-band
Discrimination and characterization of membrane domains at W-band
Feasibility for performing experiments on eye lenses from a single human donor
Acknowledgements
This work was supported by grants EY015526, EB002052, EB001980, and EY001931 from the National Institutes of Health.
Footnotes
Publisher's Disclaimer: This is a PDF file of an unedited manuscript that has been accepted for publication. As a service to our customers we are providing this early version of the manuscript. The manuscript will undergo copyediting, typesetting, and review of the resulting proof before it is published in its final citable form. Please note that during the production process errors may be discovered which could affect the content, and all legal disclaimers that apply to the journal pertain.
References
- 1.Hyde JS. In: Saturation recovery. Eaton GR, Eaton SS, Salikhov KM, editors. Foundations of Modern EPR, World Scientific; Singapore: 1998. pp. 607–618. [Google Scholar]
- 2.Yin JJ, Subczynski WK. Effects of lutein and cholesterol on alkyl chain bending in lipid bilayers: a pulse electron spin resonance spin labeling study. Biophys. J. 1996;71:832–839. doi: 10.1016/S0006-3495(96)79284-6. [DOI] [PMC free article] [PubMed] [Google Scholar]
- 3.Hyde JS, Yin JJ, Subczynski WK, Camenisch TG, Ratke JJ, Froncisz W. Spin-label EPR T1 values using saturation recovery from 2 to 35 GHz. J. Phys. Chem. B. 2004;108:9524–9529. [Google Scholar]
- 4.Froncisz W, Camenisch TG, Ratke JJ, Anderson JR, Subczynski WK, Strangeway RA, Sidabras JW, Hyde JS. Saturation recovery EPR and ELDOR at W-band for spin labels. J. Magn. Reson. 2008;193:297–304. doi: 10.1016/j.jmr.2008.05.008. [DOI] [PMC free article] [PubMed] [Google Scholar]
- 5.Subczynski WK, Mainali L, Camenisch TG, Froncisz W, Hyde JS. Spin-label oximetry at Q- and W-band. J. Magn. Reson. 2011;209:142–148. doi: 10.1016/j.jmr.2011.01.003. [DOI] [PMC free article] [PubMed] [Google Scholar]
- 6.Widomska J, Raguz M, Dillon J, Gaillard ER, Subczynski WK. Physical properties of the lipid bilayer membrane made of calf lens lipids: EPR spin labeling studies. Biochim. Biophys. Acta. 2007;1768:1454–1465. doi: 10.1016/j.bbamem.2007.03.007. [DOI] [PMC free article] [PubMed] [Google Scholar]
- 7.Widomska J, Raguz M, Subczynski WK. Oxygen permeability of the lipid bilayer membrane made of calf lens lipids. Biochim. Biophys. Acta. 2007;1768:2636–2645. doi: 10.1016/j.bbamem.2007.06.018. [DOI] [PMC free article] [PubMed] [Google Scholar]
- 8.Raguz M, Widomska J, Dillon J, Gaillard ER, Subczy nski WK. Characterization of lipid domains in reconstituted porcine lens membranes using EPR spin-labeling approaches. Biochim. Biophys. Acta. 2008;1778:1079–1090. doi: 10.1016/j.bbamem.2008.01.024. [DOI] [PMC free article] [PubMed] [Google Scholar]
- 9.Raguz M, Widomska J, Dillon J, Gaillard ER, Subczynski WK. Physical properties of the lipid bilayer membrane made of cortical and nuclear bovine lens lipids: EPR spin-labeling studies. Biochim. Biophys. Acta. 2009;1788:2380–2388. doi: 10.1016/j.bbamem.2009.09.005. [DOI] [PMC free article] [PubMed] [Google Scholar]
- 10.Subczynski WK, Widomska J, Wisniewska A, Kusumi A. Saturation-recovery electron paramagnetic resonance discrimination by oxygen transport (DOT) method for characterizing membrane domains. Methods Mol. Biol. 2007;398:143–157. doi: 10.1007/978-1-59745-513-8_11. [DOI] [PubMed] [Google Scholar]
- 11.Subczynski WK, Raguz M, Widomska J. Studying lipid organization in biological membranes using liposomes and EPR spin labeling. Methods Mol. Biol. 2010;606:247–269. doi: 10.1007/978-1-60761-447-0_18. [DOI] [PMC free article] [PubMed] [Google Scholar]
- 12.Marsh D. Electron spin resonance: spin labels. In: Grell E, editor. Membrane Spectroscopy. Springer-Verlag; Berlin: 1981. pp. 51–142. [DOI] [PubMed] [Google Scholar]
- 13.Subczynski WK, Wisniewska A, Yin JJ, Hyde JS, Kusumi A. Hydrophobic barriers of lipid bilayer membranes formed by reduction of water penetration by alkyl chain unsaturation and cholesterol. Biochemistry. 1994;33:7670–7681. doi: 10.1021/bi00190a022. [DOI] [PubMed] [Google Scholar]
- 14.Kusumi A, Subczynski WK, Hyde JS. Oxyge n transport parameter in membranes as deduced by saturation recovery measurements of spin-lattice relaxation times of spin labels. Proc. Natl. Acad. Sci. USA. 1982;79:1854–1858. doi: 10.1073/pnas.79.6.1854. [DOI] [PMC free article] [PubMed] [Google Scholar]
- 15.Raguz M, Mainali L, Widomska J, Subczynski WK. The immiscible cholesterol bilayer domain exists as an integral part of phospholipid bilayer membranes. Biochim. Biophys. Acta. 2011;1808:1072–1080. doi: 10.1016/j.bbamem.2010.12.019. [DOI] [PMC free article] [PubMed] [Google Scholar]
- 16.Wachtel EJ, Borochov N, Bach D. The effect of protons or calcium ions on the phase behavior of phosphatidylserine-cholesterol mixtures. Biochim. Biophys. Acta. 1991;1066:63–69. doi: 10.1016/0005-2736(91)90251-3. [DOI] [PubMed] [Google Scholar]
- 17.Borochov N, Wachtel EJ, Bach D. Phase behavior of mixtures of cholesterol and saturated phosphatidylglycerols. Chem. Phys. Lipids. 1995;76:85–92. doi: 10.1016/0009-3084(94)02411-w. [DOI] [PubMed] [Google Scholar]
- 18.Epand RM. Cholesterol in bilayers of sphingomyelin or dihydrosphingomyelin at concentrations found in ocular lens membranes. Biophys. J. 2003;84:3102–3110. doi: 10.1016/S0006-3495(03)70035-6. [DOI] [PMC free article] [PubMed] [Google Scholar]
- 19.Preston Mason R, Tulenko TN, Jacob RF. Direct evidence for cholesterol crystalline domains in biological membranes: role in human pathobiology. Biochim. Biophys. Acta. 2003;1610:198–207. doi: 10.1016/s0005-2736(03)00018-x. [DOI] [PubMed] [Google Scholar]
- 20.Cheetham JJ, Wachtel E, Bach D, Epand RM. Role of the stereochemistry of the hydroxyl group of cholesterol and the formation of nonbilayer structures in phosphatidylethanolamines. Biochemistry. 1989;28:8928–8934. doi: 10.1021/bi00448a036. [DOI] [PubMed] [Google Scholar]
- 21.Knoll W, Schmidt G, Ibel K, Sackmann E. Small-angle neutron scattering study of lateral phase separation in dimyristoylphosphatidylcholine-cholesterol mixed membranes. Biochemistry. 1985;24:5240–5246. doi: 10.1021/bi00340a043. [DOI] [PubMed] [Google Scholar]
- 22.Roy D, Rosenfeld L, Spector A. Lens plasma membrane: isolation and biochemical characterization. Exp. Eye Res. 1982;35:113–129. doi: 10.1016/s0014-4835(82)80060-2. [DOI] [PubMed] [Google Scholar]
- 23.Folch J, Lees M, Sloane Stanley GH. A simple method for the isolation and purification of total lipids from animal tissues. J Biol. Chem. 1957;226:497–509. [PubMed] [Google Scholar]
- 24.Hyde JS, Subczynski WK. Spin-label oximetry. In: Berliner LJ, Reuben J, editors. Spin Labeling: Theory and Applications. Vol. 8. Plenum Press; New York: 1989. pp. 399–425. [Google Scholar]
- 25.Subczynski WK, Felix CC, Klug CS, Hyde JS. Concentration by centrifugation for gas exchange EPR oximetry measurements with loop-gap resonators. J. Magn. Reson. 2005;176:244–248. doi: 10.1016/j.jmr.2005.06.011. [DOI] [PubMed] [Google Scholar]
- 26.Sidabras JW, Mett RR, Froncisz W, Camenisch TG, Anderson JR, Hyde JS. Multipurpose EPR loop-gap resonator and cylindrical TE011 cavity for aqueous samples at 94 GHz. Rev. Sci. Instrum. 2007;78:034701. doi: 10.1063/1.2709746. [DOI] [PubMed] [Google Scholar]
- 27.Laiken SL, Printz MP. Kinetic class analysis of hydrogen-exchange data. Biochemistry. 1970;9:1547–1553. doi: 10.1021/bi00809a011. [DOI] [PubMed] [Google Scholar]
- 28.Pasenkiewicz-Gierula M, Antholine WE, Subczynski WK, Baffa O, Hyde JS, Petering DH. Assessment of the ESR spectra of copper 3-ethoxy-2-oxobutyraldehyde bis(thiosemicarbazonate) complexes CuKTSM2. Inorg. Chem. 1987;26:3945–3949. [Google Scholar]
- 29.Hubbell WL, McConnell HM. Spin-label studies of the excitable membranes of nerve and muscle. Proc. Natl. Acad. Sci. USA. 1968;61:12–16. doi: 10.1073/pnas.61.1.12. [DOI] [PMC free article] [PubMed] [Google Scholar]
- 30.Zhang Z, Fleissner MR, Tipikin DS, Liang Z, Moscicki JK, Earle KA, Hubbell WL, Freed JH. Multifrequency electron spin resonance study of the dynamics of spin labeled T4 lysozyme. J. Phys. Chem. B. 2010;114:5503–5521. doi: 10.1021/jp910606h. [DOI] [PMC free article] [PubMed] [Google Scholar]
- 31.Dzikovski B, Earle K, Pachtchenko S, Freed J. High-field ESR on aligned membranes: a simple method to record spectra from different membrane orientations in the magnetic field. J. Magn. Reson. 2006;179:273–279. doi: 10.1016/j.jmr.2005.12.015. [DOI] [PubMed] [Google Scholar]
- 32.Lou Y, Ge M, Freed JH. A multifreque ncy ESR study of the complex dynamics of membranes. J. Phys. Chem. B. 2001;105:11053–11056. [Google Scholar]
- 33.Dzikovski B, Tipikin D, Livshits V, Earle K, Freed J. Multifrequency ESR study of spin-labeled molecules in inclusion compounds with cyclodextrins. Phys. Chem. Chem. Phys. 2009;11:6676–6688. doi: 10.1039/b903490k. [DOI] [PMC free article] [PubMed] [Google Scholar]
- 34.Li LK, So L, Spector A. Membrane cholesterol and phospholipid in consecutive concentric sections of human lenses. J. Lipid Res. 1985;26:600–609. [PubMed] [Google Scholar]
- 35.Li LK, So L, Spector A. Age-dependent changes in the distribution and concentration of human lens cholesterol and phospholipids. Biochim. Biophys. Acta. 1987;917:112–120. doi: 10.1016/0005-2760(87)90291-8. [DOI] [PubMed] [Google Scholar]
- 36.Deeley JM, Mitchell TW, Wei X, Korth J, Nealon JR, Blanksby SJ, Truscott RJ. Human lens lipids differ markedly from those of commonly used experimental animals. Biochim. Biophys. Acta. 2008;1781:288–298. doi: 10.1016/j.bbalip.2008.04.002. [DOI] [PubMed] [Google Scholar]
- 37.Li LK, So L. Age dependent lipid and protein changes in individual bovine lenses. Curr. Eye Res. 1987;6:599–605. doi: 10.3109/02713688709025219. [DOI] [PubMed] [Google Scholar]
- 38.Atkins PW, Kivelson D. ESR linewidth in solution. II. Analysis of spin-rotational relaxation data. J. Chem. Phys. 1966;44:169–174. [Google Scholar]
- 39.Mailer C, Nielsen RD, Robinson BH. Explanation of spin-lattice relaxation rates of spin labels obtained with multifrequency saturation recovery EPR. J. Phys. Chem. A. 2005;109:4049–4061. doi: 10.1021/jp044671l. [DOI] [PubMed] [Google Scholar]
- 40.Subczynski WK, Wisniewska A, Hyde JS, Kusumi A. Three-dimensional dynamic structure of the liquid-ordered domain in lipid membranes as examined by pulse-EPR oxygen probing. Biophys. J. 2007;92:1573–1584. doi: 10.1529/biophysj.106.097568. [DOI] [PMC free article] [PubMed] [Google Scholar]
- 41.Ashikawa I, Yin JJ, Subczynski WK, Kouyama T, Hyde JS, Kusumi A. Molecular organization and dynamics in bacteriorhodopsin-rich reconstituted membranes: discrimination of lipid environments by the oxygen transport parameter using a pulse ESR spin-labeling technique. Biochemistry. 1994;33:4947–4952. doi: 10.1021/bi00182a025. [DOI] [PubMed] [Google Scholar]
- 42.Kawasaki K, Yin JJ, Subczynski WK, Hyde JS, Kusumi A. Pulse EPR detection of lipid exchange between protein-rich raft and bulk domains in the membrane: methodology development and its application to studies of influenza viral membrane. Biophys. J. 2001;80:738–748. doi: 10.1016/S0006-3495(01)76053-5. [DOI] [PMC free article] [PubMed] [Google Scholar]


