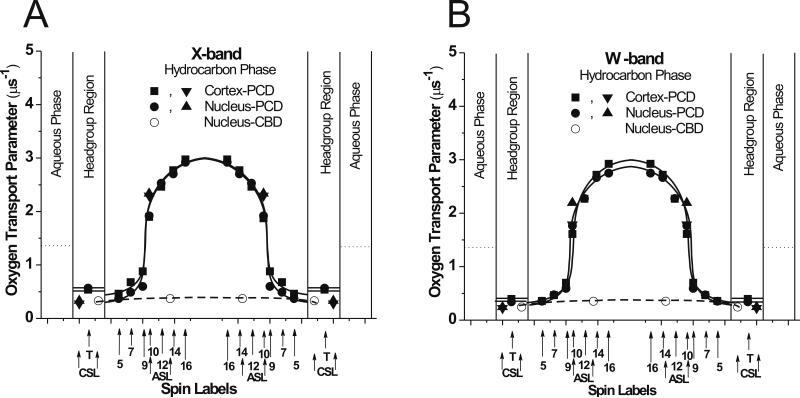
Fig. 6.
Profiles of the oxygen transport parameter (oxygen diffusion-concentration product) at 25°C across certain domains in cortical and nuclear porcine lens lipid membranes obtained at X-band (A) and W-band (B). Dotted lines indicate the oxygen transport parameter in the aqueous phase. Approximate localizations of nitroxide moieties of spin labels are indicated by arrows. Points obtained for phospholipid-type spin labels are indicated as ■ and ●, and points obtained for cholesterol-type spin labels are indicated as ▼, ◀, and ○. Two arrows for ASL and CSL indicate locations of these spin labels in the PCD and the CBD (see Ref. [9] for information about the location of nitroxide moieties of ASL and CSL in the PCD and the CBD).

