
Fig. 6.
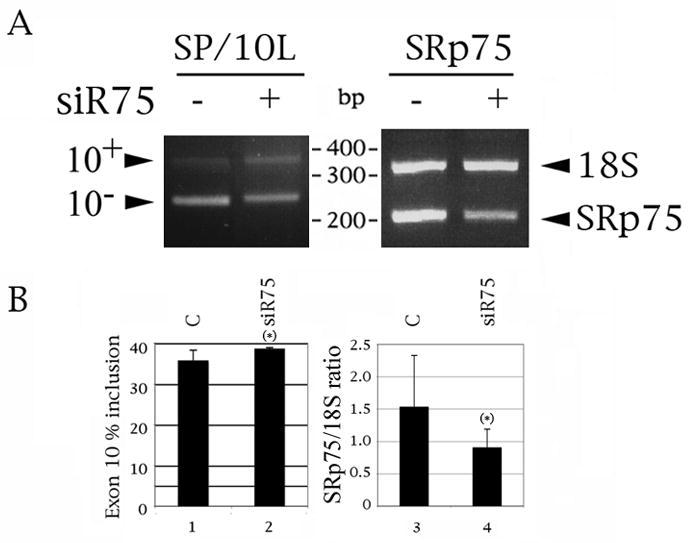
Suppression of SRp75 slightly increases inclusion of exon 10, although the changes in both SRp75 and exon 10 just miss attaining statistical significance. 1 ug of SP/10L was transfected into HeLa cells following transfection of control or Si75 RNA (Santa Cruz). (A) A representative result of the effect of si75 on transfected tau (left) and endogenous SRp75 (right). DNA marker sizes are indicated between the panels. The exon 10, 18S and SRp75 PCR products are indicated on the left and right of the panels, respectively. (B, left panel) Quantitative RT-PCR of tau exon 10. (B, right panel) Quantitative RT-PCR of endogenous SRp75. The ratio of SRp75 to 18S is indicated. Primer pair: 75-PS/75RRRM-1N. The 18S:competimer ratio was 3:7. Exon ratio calculations, primers, graph conventions and p-value notations are as in Fig. 1C.