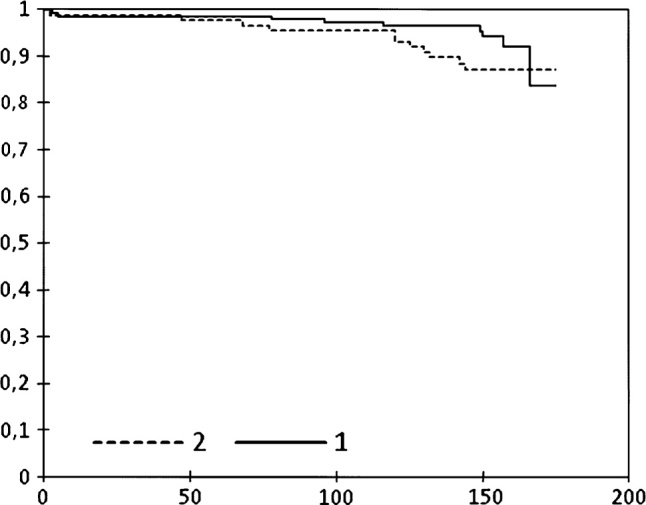
Fig. 3.

Comparison between resurfaced patella (group 1, continuous line) and unresurfaced patella (group 2, dotted line) total knee arthroplasties. Kaplan–Meier curve of survival rate with failure with revision as the endpoint. Time reported in months
