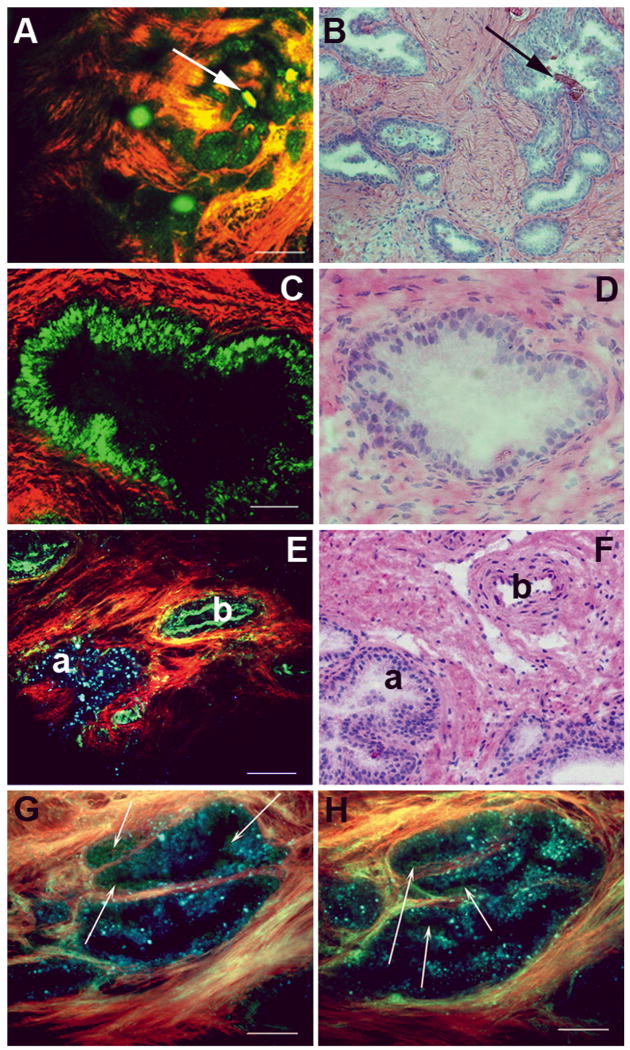
FIG. 2.
MPM and corresponding histology images of the prostate gland. (A, B) Low-magnification image of human prostate gland showing concretions. The MPM image (A) shows acini containing structures that are probably concretions (green; shown by arrows) and collagenous stroma (red). Panel B shows an H&E-stained sample from a corresponding area. (C, D) Higher-magnification view of prostatic glands. The MPM image (C) shows acinar cells (green) and collagenous stroma (red). Panel D shows image of H&E-stained sections from a corresponding area. (E, F) Prostatic acinus and nearby artery (on the capsule) showing differing autofluorescence signals. The prostate gland exhibits punctate fluorescence (a) over a very broad wavelength range (420–650 nm). By contrast, elastin fluorescence in the artery (b) is predominantly restricted to the shorter wavelength channel (420–530 nm). Panel F shows H&E-stained sections from corresponding areas of the same specimen. (G, H) Higher magnification of prostatic acini imaged using three detector channels (two for autofluorescence; identical imaging conditions as in panel E). Here, cells emit mostly in the 420–530 nm range and thus appear green in the colour-coding scheme. By contrast, the gland-associated punctate fluorescence (which could represent lipofuscin deposits) emits over a broader wavelength range, and thus appears bluer in the colour-coding scheme (arrows point to bona fide cells with distinct nuclei). Colour-coding of MPM images: red, SHG (355–420 nm); green, short-wavelength autofluorescence (420–530 nm); blue, long-wavelength autofluorescence (530–650 nm). Scale bars: A, E, 200 μm; C, 50 μm; G, H, 100 μm.

