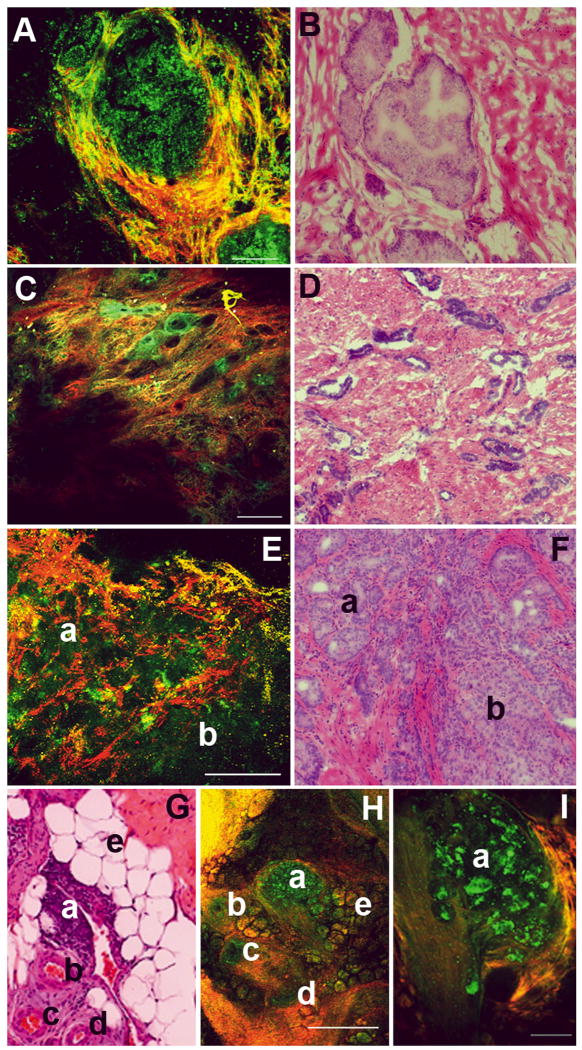
FIG. 3.
MPM and corresponding histopathology images of intraprostatic and periprostatic alterations, including benign and malignant lesions. (A, B) Prostatic epithelial hyperplasia. The MPM image (A) shows an acinus where the lumen is nearly filled with proliferating cells (autofluorescent). The acinus is demarcated by the presence of surrounding fibrocollagenous stroma. Panel B shows an H&E-stained sample from a corresponding area. (C, D) Panel C shows a low-magnification image of a malignant low-grade prostate cancer (Gleason grade 3), with small glands dispersed in the prominent fibrocollagenous stroma. Panel D shows H&E-stained image from a corresponding area. (E, F) Low-magnification images of human prostate gland showing high Gleason grade tumour. In the MPM image (panel E), two regions can be identified: small glands can still be distinguished (a, Gleason grade 3) and sheets of fused glands with no glandular architecture or intervening stroma (b, Gleason grade 4). Panel F shows an H&E-stained image from a corresponding area. (G–I) Inflammatory pathology in the LPF. Panel H shows a low-magnification MPM image of a region of the fascia where we can identify a lymphoid aggregate (a), several arteries (b–d) and fat (e). Panel I shows a higher magnification of the lymphoid aggregate, with individual lymphocytes visible. Panel G shows an H&E-stained section of the corresponding area of the same specimen. Colour-coding of MPM images: A, C: red, SHG; green: autofluorescence between 420 and 530 nm. Scale bars: A, I, 100 μm; C, H, 500 μm; E, 200 μm.

