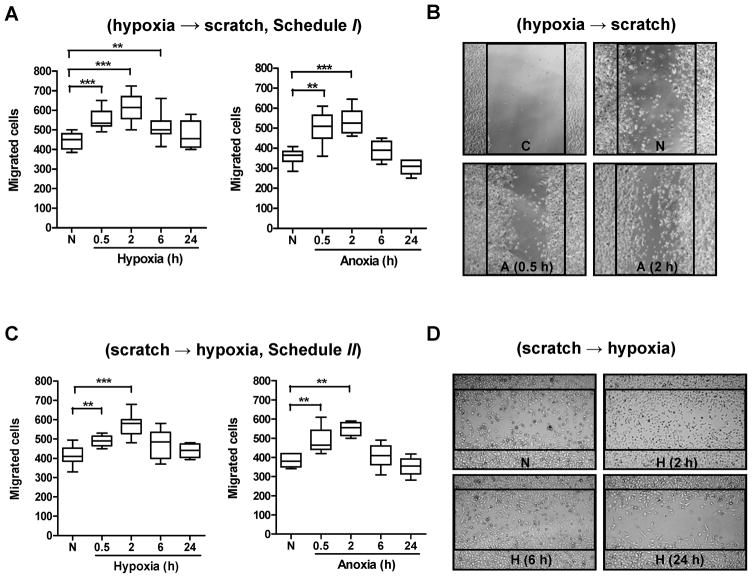
Fig. 1.
Motility of tumor cells exposed to acute and chronic hypoxia or anoxia. (A) PC-3 cells grown as monolayers were exposed to hypoxia or anoxia, then scratches were made and cells were incubated under normoxia for an additional 24 h. (B) Typical photographs of A are shown (original magnification, ×50). C=control (0 h after scratching); N=normoxia; A=anoxia. (C) PC-3 cell monolayers were scratched and then incubated under hypoxia/anoxia for 0.5, 2, 6 or 24 h, followed by re-culturing under normoxia for 23.5, 22, 18 or 0 h, respectively. (D) Typical photographs of C are shown (original magnification, ×50). N=normoxia; H=hypoxia. Cells that migrated into the denuded areas were scored from 4 random fields/sample with ≥3 independent samples. *, p < 0.05; **, p < 0.01; ***, p < 0.001 (n≥12, Wilcoxon test). The global effect of hypoxia on cell migration was analyzed by the Kruskal-Wallis test.

