Fig. 4.
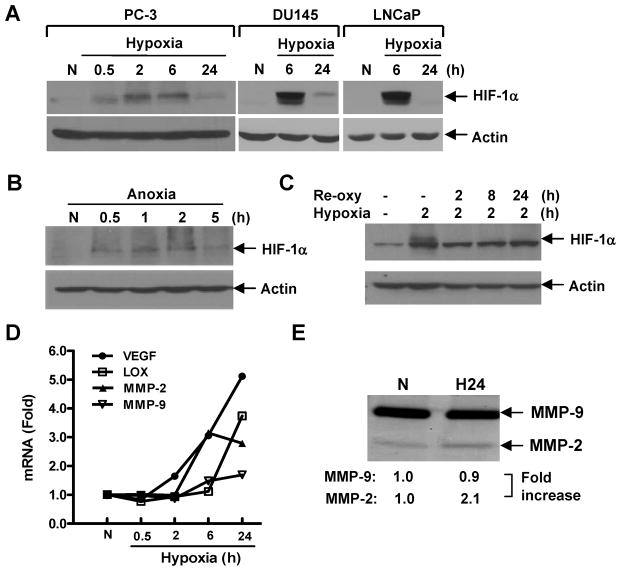
Molecular response of prostate cancer cells under hypoxia. (A) PC-3, DU145 and LNCaP cells were exposed to 1% oxygen for various periods of time. (B) PC-3 cells were exposed to 0% oxygen for various periods of time. (C) PC-3 cells were exposed to 1% oxygen for 2 h followed by reoxygenation (Re-oxy). Whole cell lysates (A and C) or nuclear extracts (B) were analyzed by Western blot for HIF-1α expression using actin as a loading control. (D) PC-3 cells were exposed to 1% oxygen as in A and HIF-1-target gene expression was determined by qPCR. Bars, SD (n=3). (E) PC-3 cells were cultured under hypoxia or normoxia in serum-free medium for 24 h. Conditioned medium (from 2×10⁵ cells) was harvested for gelatin zymography analysis. N=normoxia; H=hypoxia.

