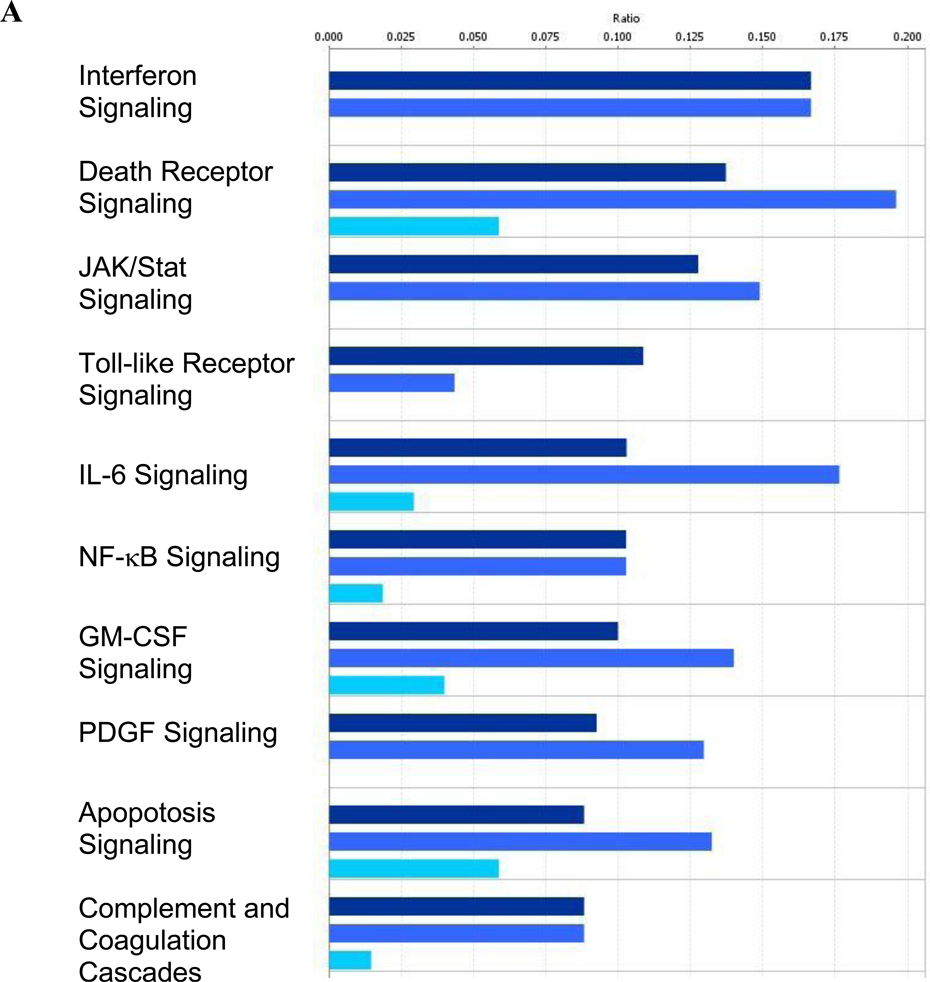
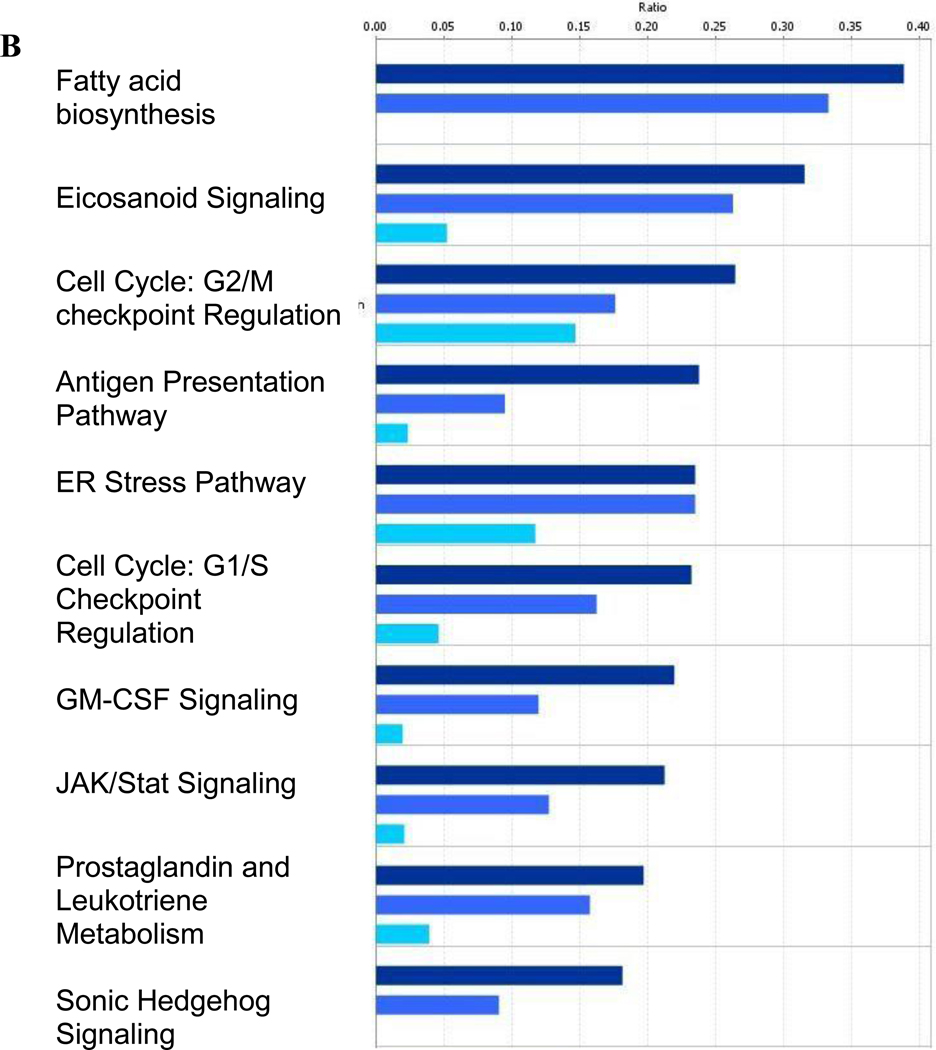
Figure 2.
Over-represented canonical pathways identified by Ingenuity Pathway Analysis in RAW264.7 macrophages at (A) 6 hours and (B) 24 hours post-treatment. Differentially expressed genes from the Venn diagrams in Figure 1 were used for the pathway analysis. Poly (I:C) data are shown in navy bars, LPS data are in medium blue, and CpG DNA data are depicted by light blue bars.


