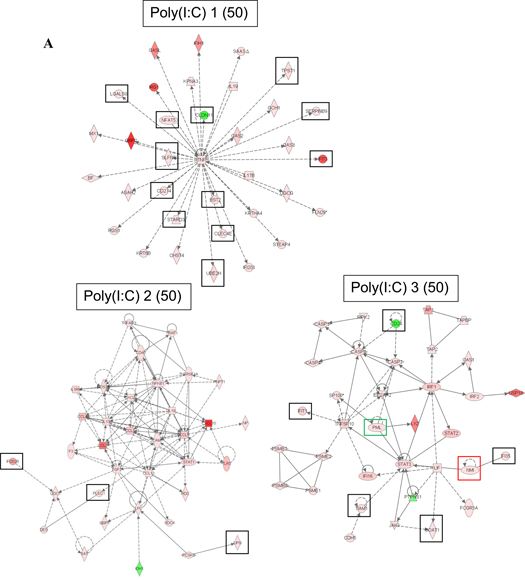
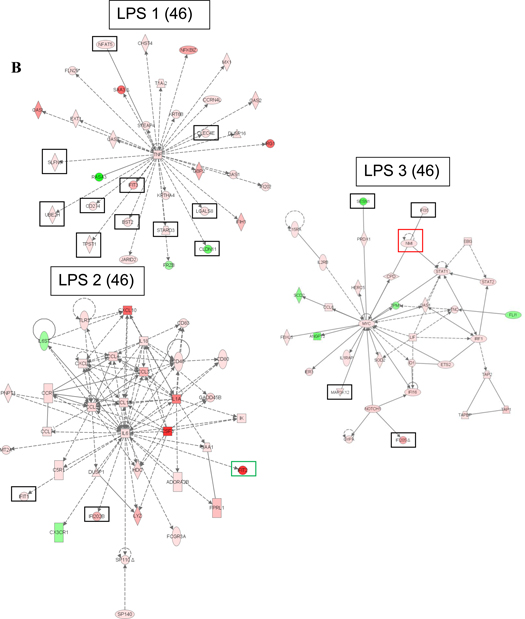
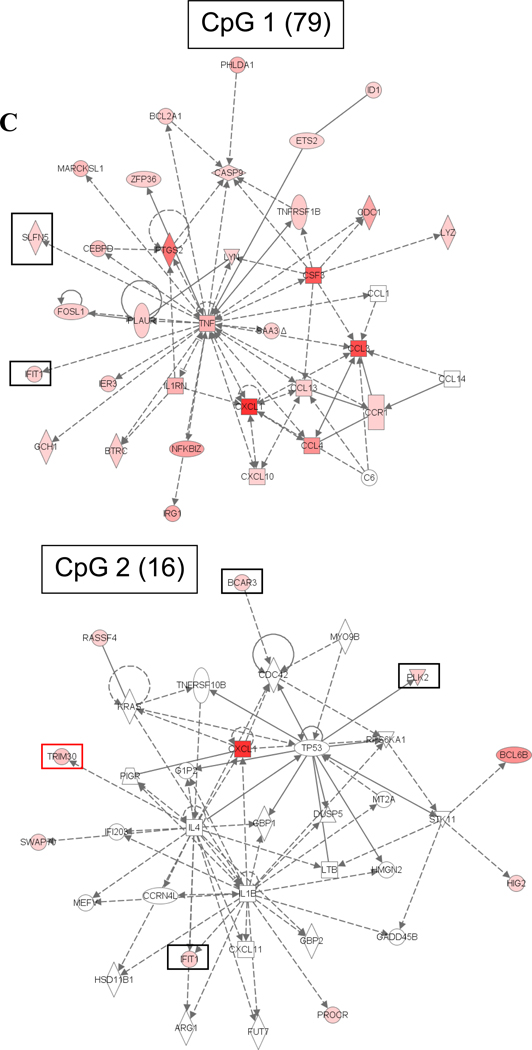
Figure 3.
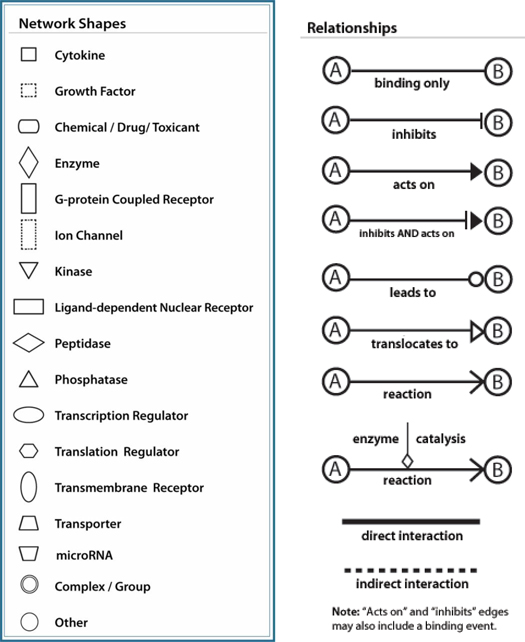
Top significant transcriptional networks in (A) poly (I:C), (B) LPS, and (C) CpG DNA gene expression data 6 hours post-treatment. Networks are labeled with their IPA ranking and IPA score in parenthesis. The score is the negative exponent of the right-tailed Fisher's exact test p-value that tests the likelihood that the Network Eligible Molecules that are part of a network are found therein by random chance alone. Black boxes denote genes selected for RNA interference assays in macrophages in this study, green boxes denote two genes we have identified in our previous studies whose RNAi-mediated inhibition resulted in significantly lower cytokine production in macrophages (Alper et al., 2008), and red boxes denote two genes we identified in our previous studies whose RNAi-mediated inhibition did not result in significantly lower cytokine production in macrophages (Yang et al., 2010; Yang et al., 2009). IPA network legend is included in the figure.


