Figure 4.
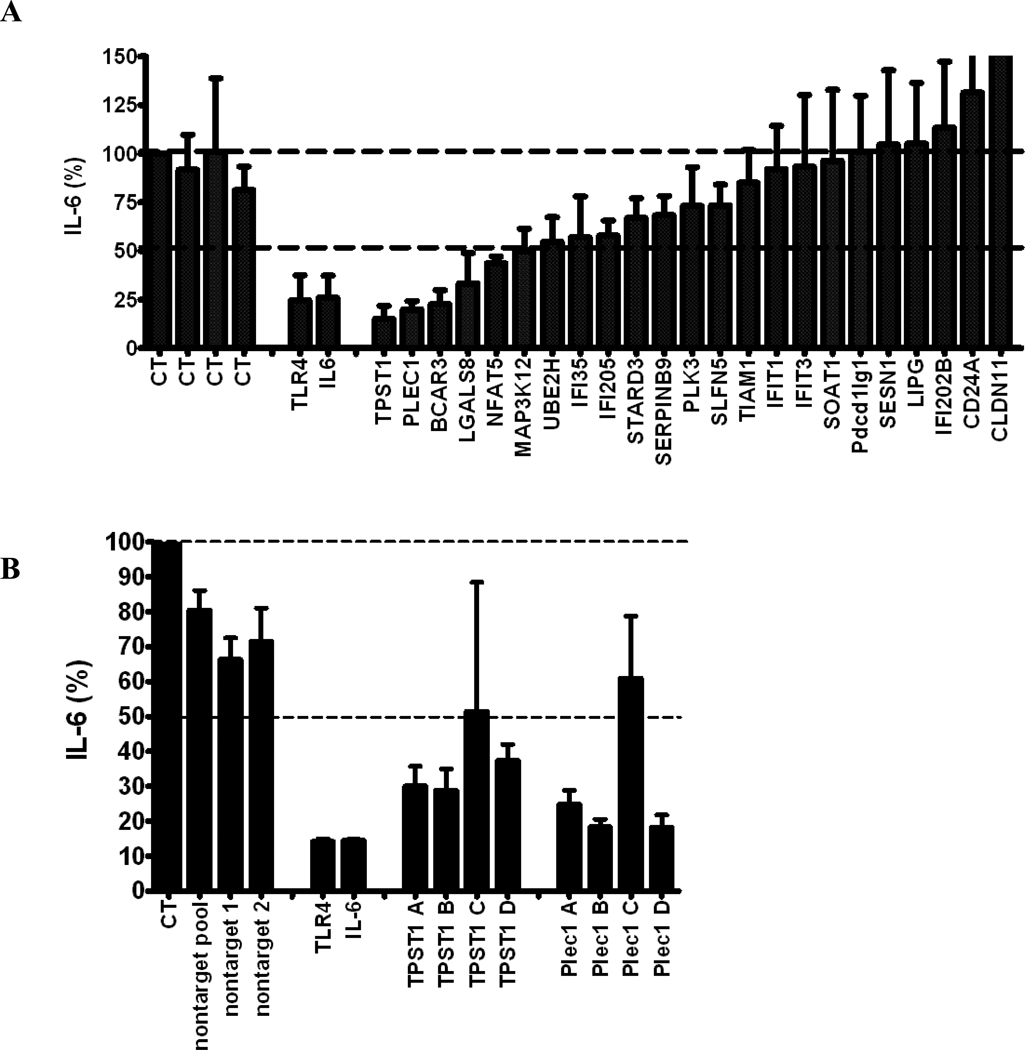
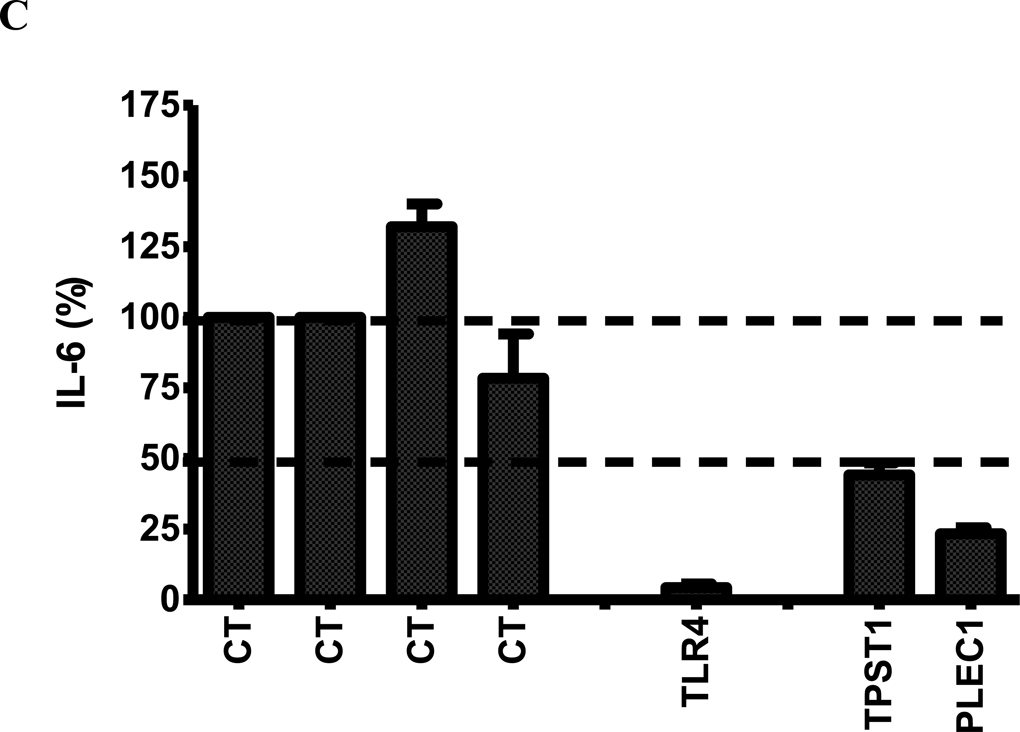
(A) The effect of RNAi-mediated inhibition of selected differentially expressed genes in Figure 3 in J77A4.1 macrophages on IL-6 production in response to LPS stimulation. Pools of 4 siRNA duplexes per gene were transfected into J77A4.1 cells, LPS was added, and cytokine production was monitored as described in Materials and Methods. Shown are the results for 4 negative controls (non-targeting siRNAs described in Materials and Methods; all data are normalized to the first negative control), 2 positive controls (TLR4 and IL-6), and 23 genes identified in the network analysis of gene expression data. (B) To verify that the phenotypes observed were caused by specific inhibition of that gene and not an off-target siRNA effect, each of the 4 siRNA duplexes in the pools were transfected individually for the 5 genes that had the strongest effect and IL-6 production was monitored. At least two independent siRNAs induced a phenotype for each gene. (C) The effect of RNAi-mediated inhibition of TPST1 and PLEC1 in RAW264.7 macrophages on IL-6 production in response to LPS stimulation 5 hours post-treatment. Pools of 4 siRNA duplexes per gene were transfected into RAW264.7 cells, LPS was added, and cytokine production was monitored as described in Materials and Methods. Shown are the results for 4 negative controls (non-targeting siRNAs described in Materials and Methods; all data are normalized to the first negative control), a positive controls (TLR4), and TPST1 and PLEC1. In all three panels, results plotted are the means of three independent siRNA experiments with error bars representing standard deviations.


