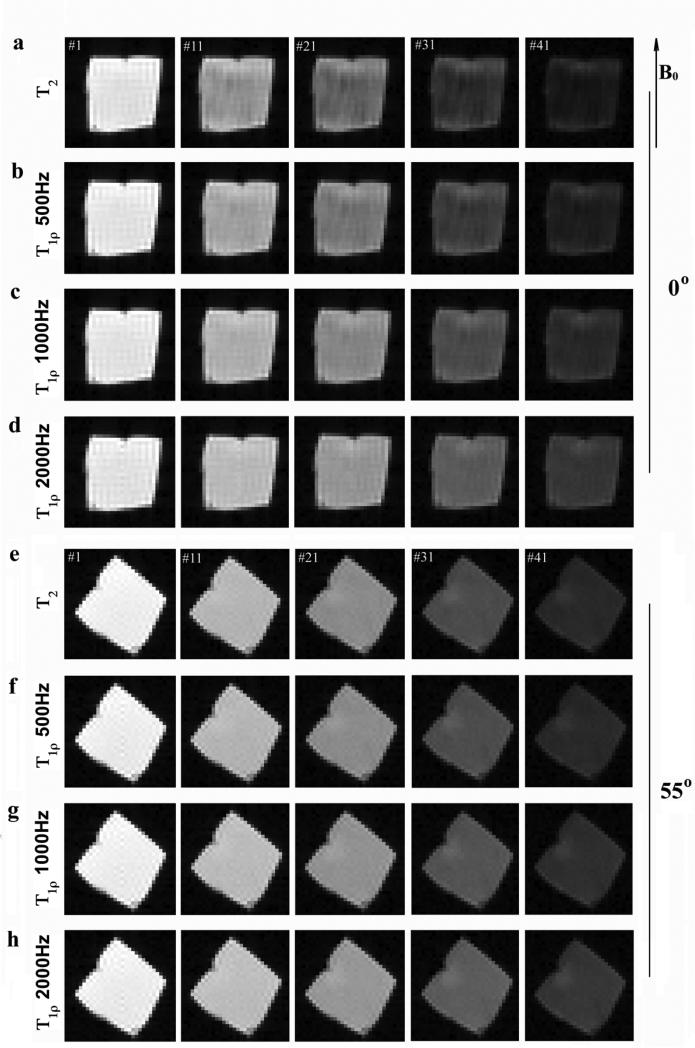
Fig 1.
The representative proton images from MRI experiments where each specimen was imaged 46 times, each with a different T2 or T1ρ weighting. All intensity images were displayed using the same maximum (32767) and minimum (0) values on the usual gray scale. The direction of the main magnetic field was directed upwards. The fibril orientation of the specimen was in parallel with the main magnetic field in (a)-(d) and 55° to the field in (e)-(h).

