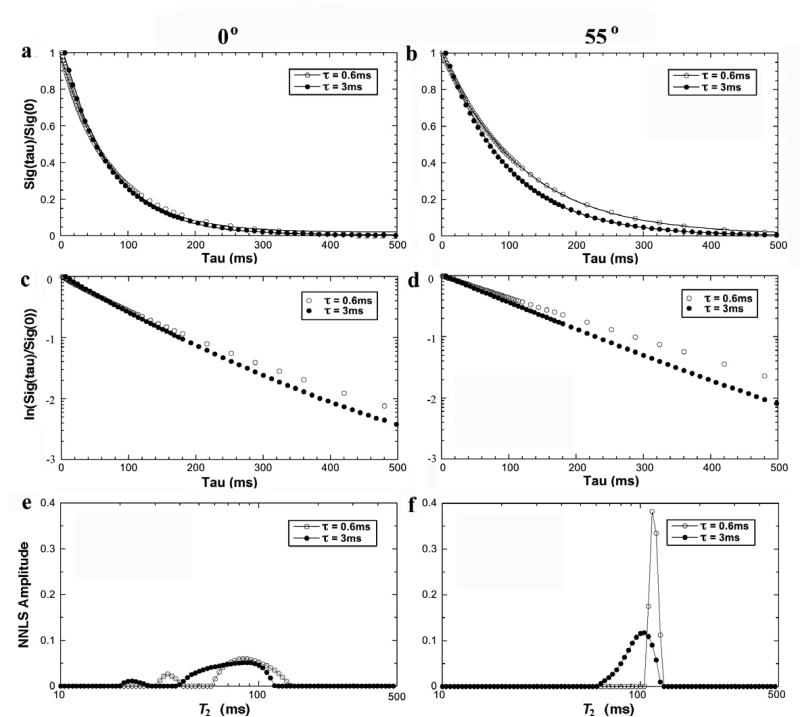
Fig 2.
The T2 results from NMR spectroscopy using different echo spacing (0.6ms, 3ms) at 0° (left) and 55° (right). (a) and (b) are the normalized signal decay in the NMR spectroscopy experiments, where the solid line in the Figure is an exponential fit with one decay-constant (i.e., one T2 component). (c) and (d) are the natural log plots of data shown in (a) and (b). (e) and (f) are the T2 distribution profiles by the NNLS calculation from the same data.

