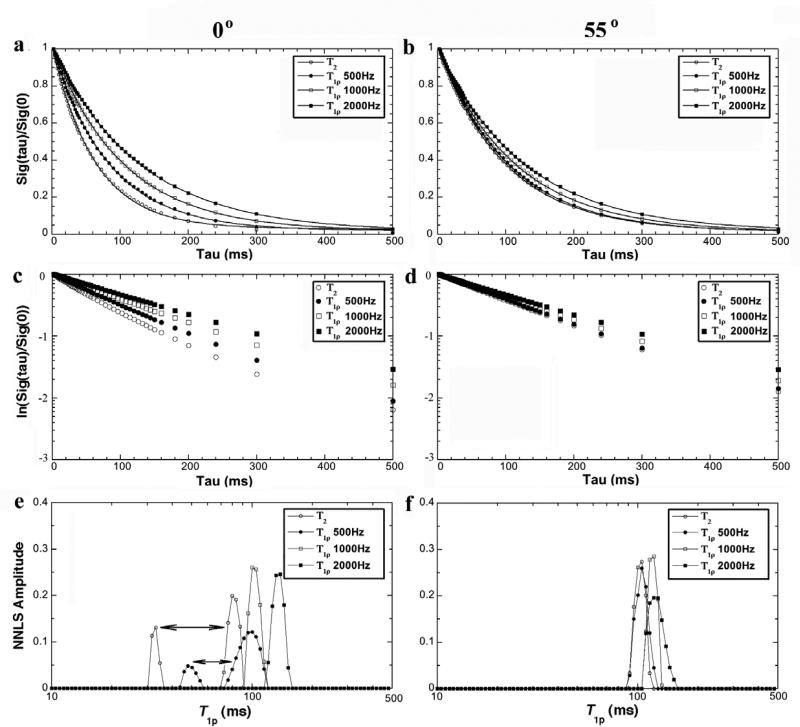
Fig 4.
The T1ρ results from MRI experiments at 0° (left) and 55° (right). (a) and (b) are the normalized signal decay in the MRI experiments, where the solid line in the figure is an exponential fit with a one decay-constant. (c) and (d) are the natural log plots of data shown in (a) and (b). (e) and (f) are the T1ρ distribution profiles by the NNLS calculation from the same data.

