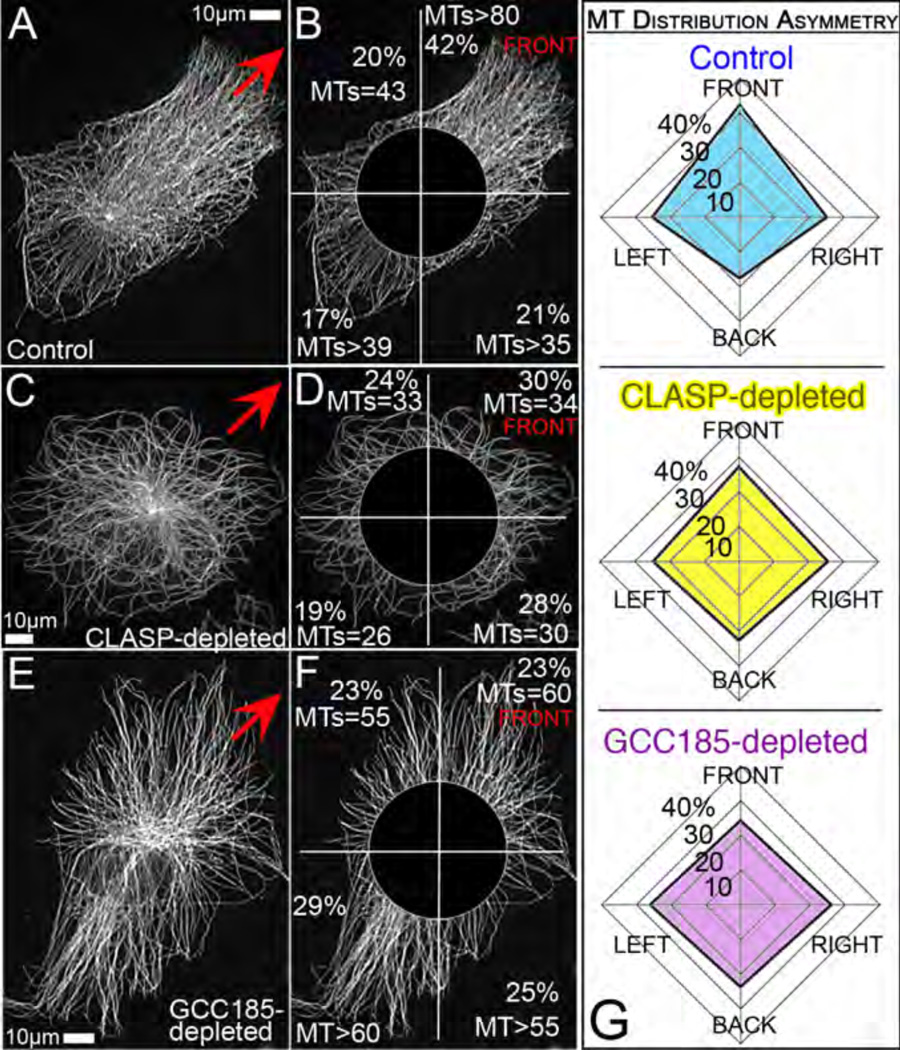
Figure 2. MT asymmetry requires Golgi-derived MTs.
Immunostained MTs in control (A,B), CLASP- (C,D) and GCC185-depleted (E,F) cells. CLASP depleted cells lack non-centrosomal MTs, while in GCC185 non-centrosomal MTs are not associated with the Golgi due to CLASP mis-localization66. Red arrows mark the front lamella direction. B,D,F, For analysis, central area is excluded and the rest of the cell divided in 4 sectors. For each sector, detectable MT numbers and average fluorescent intensity as percent of overall intensity are shown. G, Average percentage of edge MTs intensity distributed in 4 cell sectors. 20 cells for each set were analyzed. Note decreased asymmetry of diagrams for CLASP and GCC185-depleted cells. Standard deviations for front to back intensity proportion (not shown) do not overlap between control and knockdown cell populations.

